
Description
Bloc d'Ordre - Signaux de Structure de Marché
Cet instrument puissant, développé par des traders professionnels, a déjà prouvé son efficacité sur des comptes de trading réels.
Avantages clés :
- Polyvalence : fonctionne sur tous les instruments, marchés et périodes (forex, crypto, actions, obligations, futures).
- Précision : donne les meilleurs résultats sur les graphiques tick, filtrant les impulsions rapides lors de mouvements forts du marché. Fonctionne également bien sur les périodes standards.
- Flexibilité des réglages : vous permet d'adapter l'indicateur à votre style et préférences de trading.
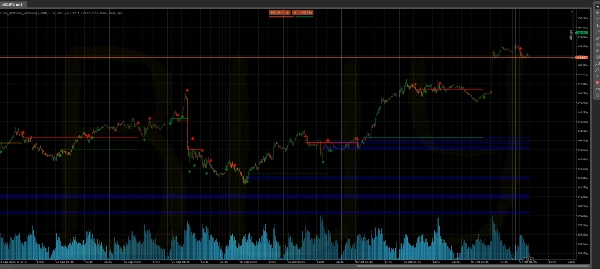
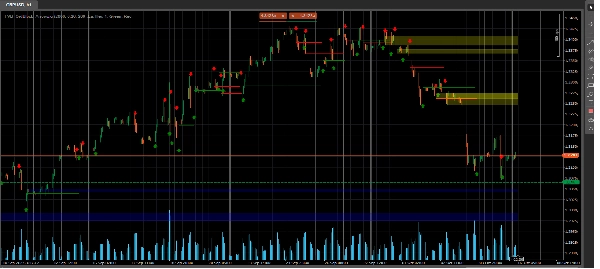
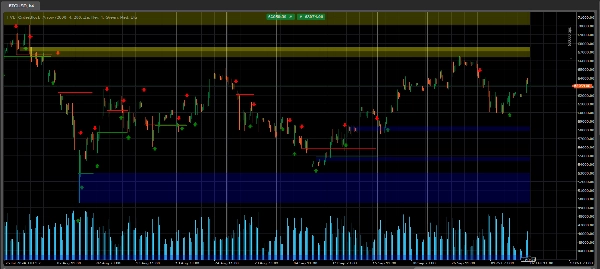
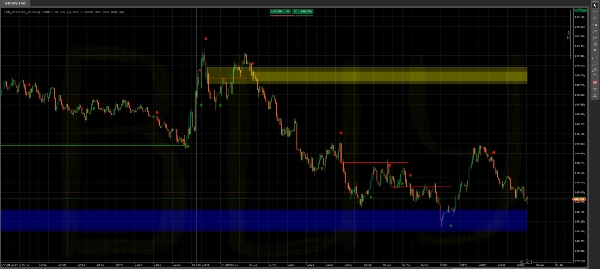
- Clarté visuelle : affiche clairement les niveaux de rupture de la structure du marché, les signaux et les zones de support/résistance (OrderBlock).
Fonctions principales :
- Calcul dynamique et affichage des zones OrderBlock
- Signaux d'entrée (flèches rouges et vertes)
- Affichage du mouvement probable de la tendance future (optionnel)
- Transparence ajustable des blocs
- Option pour supprimer les zones complétées
Considérez toujours le contexte du marché !
Réglages :
Historique des Barres - nombre de barres pour le calcul (si trop nombreuses - peut ralentir l'ordinateur). Par défaut 2000 barres.
Déviation % Zigzag - paramètre principal - calcul à partir du zigzag. Ajusté selon la période et l'instrument Block
Transparence 0-250 - transparence des blocs Supprimer Anciennes/Blocs Cassés - suppression des anciens blocs
Supprimer Flèches - ne pas afficher les flèches de signal Distance Flèche (multiplicateur ATR) - distance de la barre à la flèche en ATR ........
Supprimer Points - désactiver le dessin des points (fonction controversée - les points montrent le mouvement probable de la tendance future)
Sur le graphique : Lignes rouges et vertes - niveaux de rupture de la structure du marché Flèches rouges et vertes - signal de l'indicateur Bandes - zones OrderBlock - support et résistance. Elles sont calculées dynamiquement et supprimées lorsqu'elles sont complétées (option pour les garder sur le graphique)
Important : Le code de l'indicateur est protégé par le droit d'auteur.
Résumé
Avis clients
5 | 50 % | |
4 | 0 % | |
3 | 50 % | |
2 | 0 % | |
1 | 0 % |


