
Descrizione
Presentazione dell'Indicatore True Strength Index (TSI), uno strumento potente progettato per migliorare la tua strategia di trading fornendo chiare informazioni sul momentum del mercato e sulla forza del trend.
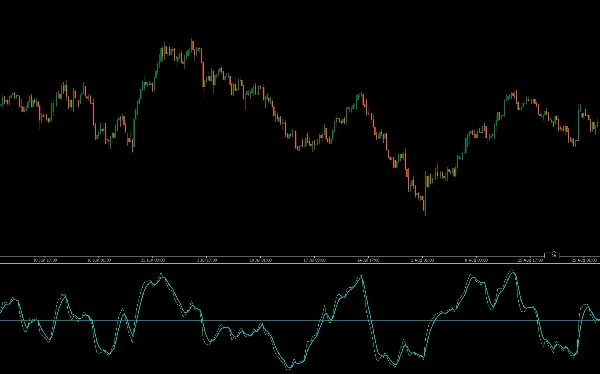
L'indicatore TSI misura la forza sottostante dei movimenti di prezzo, attenuando il rumore di mercato per offrirti un quadro più accurato della direzione del trend. Evidenziando le condizioni di ipercomprato e ipervenduto, il TSI ti aiuta a identificare potenziali punti di inversione e a confermare le continuazioni del trend.
Il TSI utilizza medie mobili del momentum sottostante di uno strumento finanziario. Il momentum è considerato un indicatore anticipatore dei movimenti di prezzo, mentre una media mobile tipicamente segue il prezzo con un certo ritardo. Il TSI combina queste caratteristiche per creare un'indicazione di prezzo e direzione più sincronizzata con le inversioni di mercato rispetto al solo momentum o alla media mobile.
Perfetto per i trader che cercano di affinare la loro analisi e migliorare il processo decisionale, l'indicatore TSI offre un modo affidabile e intuitivo per valutare la dinamica del mercato. Aggiorna la tua cassetta degli attrezzi per il trading con il True Strength Index per prestazioni di trading superiori.
- Identificazione del trend: Un TSI positivo indica un trend rialzista, mentre un TSI negativo suggerisce un trend ribassista.
- Forza del momentum: Misura quanto fortemente si muove un trend, con valori più alti che indicano un momentum più forte.
- Segnali potenziali di inversione:
-
- Incroci: Un incrocio della linea segnale vicino alla linea zero può indicare potenziali punti di ingresso e uscita.
- Divergenza: Quando il prezzo raggiunge un nuovo massimo o minimo, ma il TSI non lo fa, può segnalare una potenziale inversione del trend.
- Condizioni di ipercomprato/ipervenduto: Può aiutare a identificare quando un asset potrebbe essere ipercomprato o ipervenduto, anche se i livelli specifici di ipercomprato e ipervenduto possono variare a seconda della volatilità dell'asset.
Riepilogo
Recensioni dei clienti
5 | 0 % | |
4 | 100 % | |
3 | 0 % | |
2 | 0 % | |
1 | 0 % |


![Logo di "Gaussian Channel [Iridio Capital]"](https://cdn.ctrader.com/image/webp/7c039209-5573-4a54-a072-f9528b503103_41960)

