
Trend-reversal-indicator for cTrader
Indicator
6 purchases
Version 1.0, Mar 2025
Windows, Mac
4.0
Reviews: 1
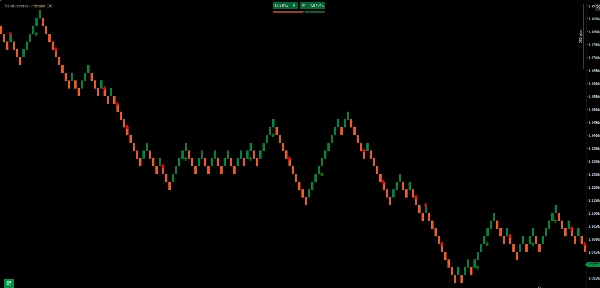
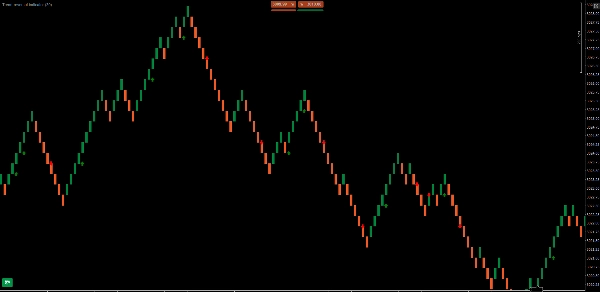
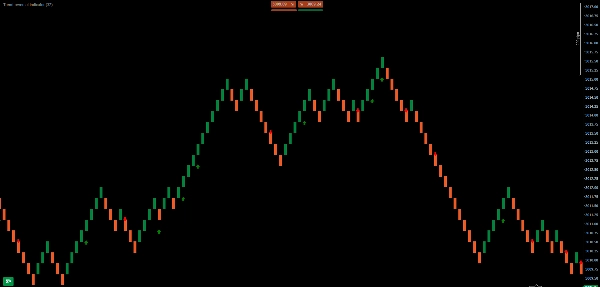
7
Sales
Description
Trend-Reversal-Indicator for cTrader
Optimized for Renko Charts - The Key to Identifying Trend Reversals
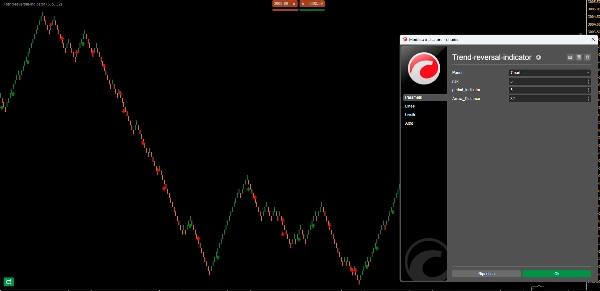
Are you a trader using Renko charts and looking to pinpoint reversals with greater accuracy? Trend-Reversal-Indicator is the ultimate tool for cTrader, designed to provide clear and reliable signals to maximize your profits.
Key Features
- Advanced Trend Reversal Analysis
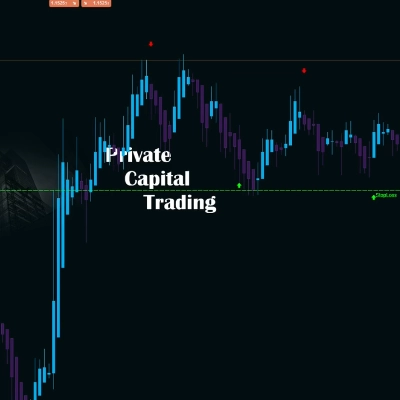
Powered by an intelligent algorithm, the Trend-Reversal-Indicator analyzes price structures on Renko charts, providing highly accurate reversal signals. - Intuitive Visual Signals
Green arrows (buy) and red arrows (sell) appear directly on the chart, making trading opportunities easy to spot. - Highly Customizable
Adjustable settings to fit your trading style: - Risk: Defines the indicator’s sensitivity to trend reversals.
- Period Indicator: Sets the number of bars used in signal calculations.
- Arrow Distance: Adjusts the space between arrows and price for better visibility.
- Fully Compatible with cTrader
Developed in cAlgo (C#), this indicator integrates seamlessly with cTrader, ensuring high performance and smooth user experience.
Why Choose the Trend-Reversal-Indicator?
- Filters Market Noise: Eliminates false signals by focusing on significant price movements.
- Enhances Timing: Helps you enter and exit trades at the right moment.
- Fits Any Strategy: Ideal for both intraday trading and long-term Renko-based strategies.
- Easy to Use: Simple setup, perfect for both beginners and experienced traders.
How to Get It?
Purchase Trend-Reversal-Indicator now and take your cTrader trading to the next level!
✅ Compatible with all Renko time frames
✅ Accurate and reliable signals
✅ Customizable to fit your trading style
Don’t miss out on this opportunity—Download it today!
Summary
AI summary
The Trend-Reversal-Indicator for cTrader is designed specifically for traders using Renko charts to identify trend reversals with improved accuracy. It employs an intelligent algorithm to analyze price structures on Renko charts, delivering precise buy and sell signals represented by green and red arrows directly on the chart for easy recognition of trading opportunities.
Key features include:
- Advanced trend reversal analysis optimized for Renko charts.
- Intuitive visual signals with customizable arrow placement.
- Adjustable settings such as risk sensitivity, period indicator (number of bars used), and arrow distance for personalized trading styles.
- Full compatibility with cTrader, developed in cAlgo (C#) for seamless integration and high performance.
The indicator filters market noise by focusing on significant price movements, enhancing trade timing for entry and exit points. It suits various strategies, including intraday and long-term Renko-based approaches, and offers a straightforward setup suitable for both beginners and experienced traders.
Compatible with all Renko time frames, the Trend-Reversal-Indicator provides accurate, reliable signals and customization options to fit individual trading preferences within the cTrader platform.
Indicator profile
Customer reviews
4.0
Reviews: 1
5 | 0 % | |
4 | 100 % | |
3 | 0 % | |
2 | 0 % | |
1 | 0 % |
Customer reviews
October 3, 2025
Nice little tool for spotting possible reversals. Super clear arrows on the chart. Works best on higher TFs. Don’t rely on it alone — combine with levels or volume for stronger entries.
Discussion
FAQ
Signal
Products available through cTrader Store, including trading bots, indicators and plugins, are provided by third-party developers and made available for informational and technical access purposes only. cTrader Store is not a broker and does not provide investment advice, personal recommendations or any guarantee of future performance.






Price
7
Sales