present
Registrieren Sie sich und erhalten Sie $50 Rabatt auf Ihren ersten Kauf
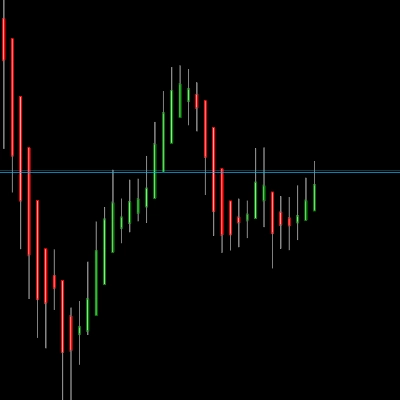
Trading product for TradeLens Indikator Chart UI Tools Key Levels, image 1
TradeLens
Indikator
Version 1.3, Sep 2026
Windows, Mac
4.5
Bewertungen: 4
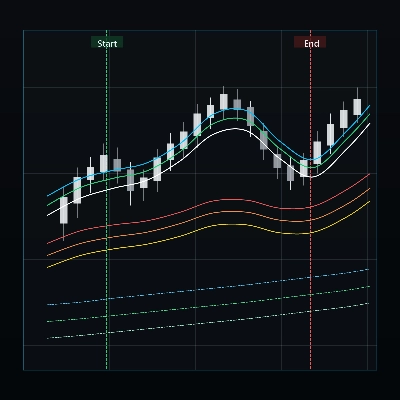
Trading product for TradeLens Indikator Chart UI Tools Key Levels, image 2
Trading product for TradeLens Indikator Chart UI Tools Key Levels, image 3
Trading product for TradeLens Indikator Chart UI Tools Key Levels, image 4
Trading product for TradeLens Indikator Chart UI Tools Key Levels, image 5
Trading product for TradeLens Indikator Chart UI Tools Key Levels, image 6
Trading product for TradeLens Indikator Chart UI Tools Key Levels, image 7
Trading product for TradeLens Indikator Chart UI Tools Key Levels, image 8
Trading product for TradeLens Indikator Chart UI Tools Key Levels, image 9
Trading product for TradeLens Indikator Chart UI Tools Key Levels, image 10
Trading product for TradeLens Indikator Chart UI Tools Key Levels, image 11
Seit 09/02/2026
29
Verkäufe
179
Kostenlose Installationen

Beschreibung

TRADELENS - KONTEXT BEHALTEN. DETAILS SEHEN.

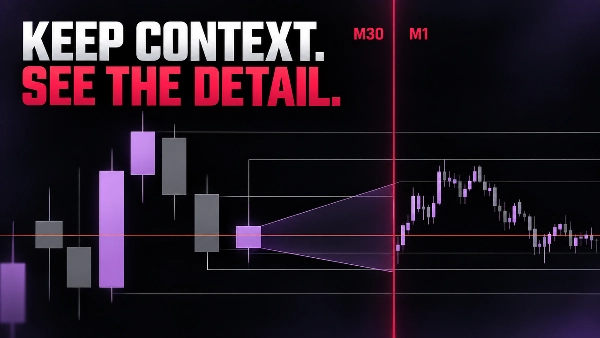
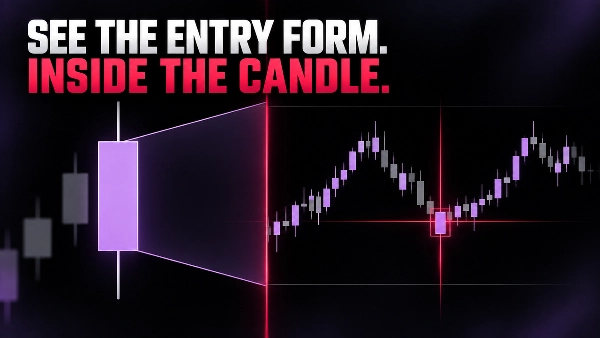
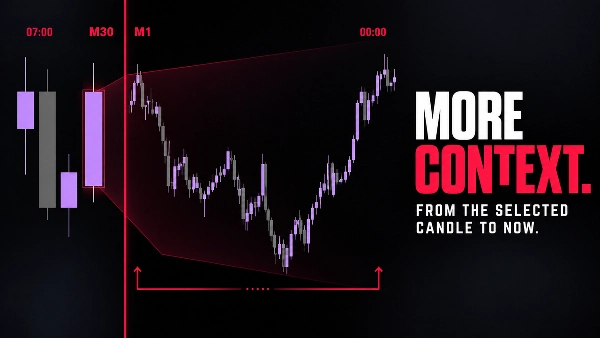
TradeLens platziert eine kompakte Kerzenansicht mit niedrigerem Zeitrahmen direkt in Ihrem aktuellen Chart. Das ursprüngliche Chart bleibt Ihr Kontext mit höherem Zeitrahmen; das Detailfenster zeigt, wie sich der Preis innerhalb der ausgewählten Kontextkerze entwickelt.

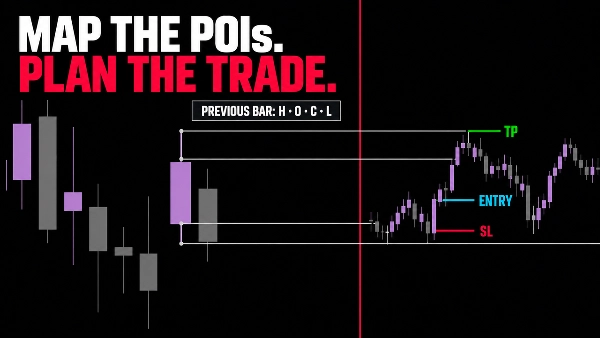
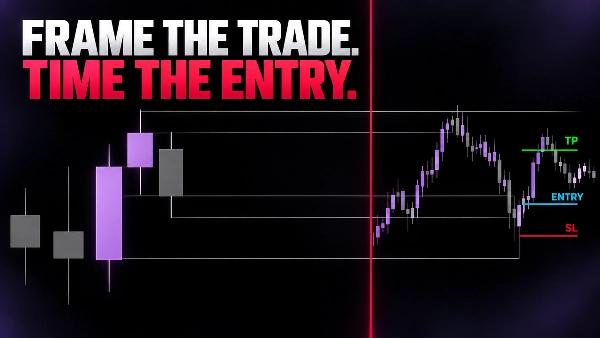
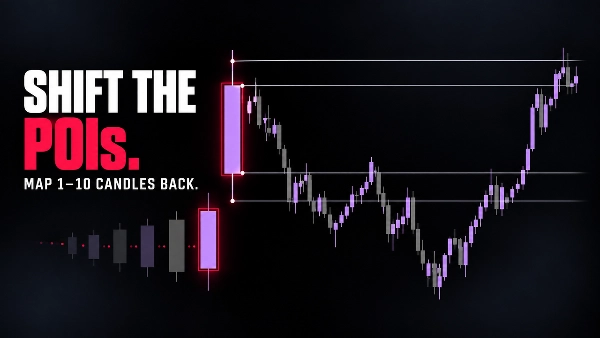
Verwenden Sie standardmäßig die aktuell entstehende Kerze oder gehen Sie zurück, um eine frühere Kontextkerze zu untersuchen. Sie können das aktive Setup mit optionalen POIs (Strahlen) am Hoch, Tief, Eröffnungs- und Schlusskurs der vorherigen geschlossenen Kerze rahmen und dann die Bewegung im niedrigeren Zeitrahmen studieren, ohne das Chart zu verlassen.

WAS TRADELENS IHNEN ZEIGT

  • Struktur im höheren Zeitrahmen und Details im niedrigeren Zeitrahmen im selben Fenster.
  • Die Entwicklung der aktuellen Kontextkerze in feinerer Skala.
  • Interessante OHLC-Punkte der vorherigen Kerze im gesamten Chart.
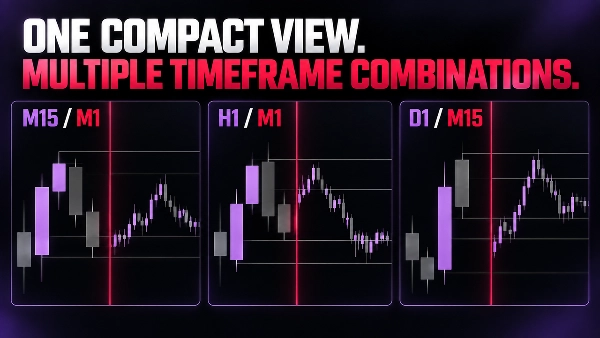
  • Kompakte Kombinationen wie M15/M1, M30/M1, H1/M1, D1/M15 und D1/M30.
  • Eine sauberere Methode, um den Einstiegstiming zu verfeinern und gleichzeitig den Kontext zu bewahren.
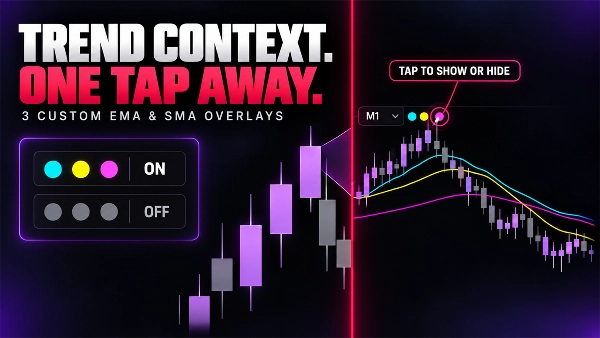
  • Fügen Sie bis zu drei anpassbare EMA- oder SMA-Overlays hinzu.
  • Zeigen oder verbergen Sie jeden Durchschnitt sofort mit Ein-Klick-Steuerungen.
  • Sehen Sie die Trendrichtung direkt in der Ansicht mit niedrigerem Zeitrahmen.

EINFACHE, VISUELLE STEUERUNGEN

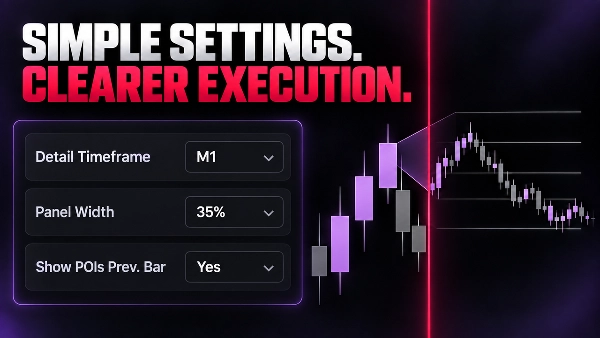
  • Detail-Zeitrahmen und Kontextkerzen-Verschiebung.
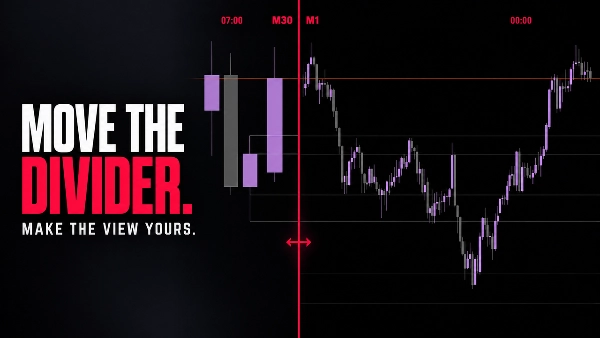
  • Breite, Hintergrund und Deckkraft des Detailfensters.
  • Farben für Bullen, Bären, Trenner und Beschriftungen.
  • Optionale POIs der vorherigen Kerze mit konfigurierbarer Farbe und Dicke.

Der Detail-Zeitrahmen muss kleiner sein als der Chart-Zeitrahmen. Wenn die Kombination ungültig ist, blendet TradeLens seine Visualisierung aus und zeigt ein deutliches Konfigurationsbanner an.

TradeLens ist ein visuelles Analysetool. Es platziert, ändert oder verwaltet keine Aufträge. Die in der Galerie gezeigten Beispiele veranschaulichen einen Chart-Lese-Workflow und sind keine Handels-Empfehlungen oder Leistungsversprechen.


Zusammenfassung

KI-Zusammenfassung
TradeLens is a chart visualization tool designed to integrate two timeframes within a single trading chart. It embeds a compact lower-timeframe candle view inside the current higher-timeframe chart, allowing traders to observe detailed price action within the context of a broader market structure. Users can analyze the progression of the current or previous context candles at a finer scale without switching charts.

Key features include optional points of interest (POIs) marking the previous bar’s Open, High, Low, and Close levels, customizable visual settings such as detail panel size, background opacity, and color schemes for bullish, bearish, and separator elements. TradeLens supports common timeframe combinations like M15/M1, M30/M1, H1/M1, D1/M15, and D1/M30, ensuring the detail timeframe is always smaller than the context timeframe.

This tool facilitates refined entry timing by preserving higher-timeframe context while providing granular lower-timeframe insights. It is a visual analysis indicator and does not execute or manage trades. TradeLens is tagged under market structure and chart UI tools, supporting analysis related to key levels, liquidity sweeps, market structure changes, and inducements.
Indikatorprofil
Indikatorkategorie
Marktstruktur (SMC)
Ausgabetyp
Visualisierung
Datenanforderungen
Nur Balken

Diskussion

Kundenbewertungen

4.5
Bewertungen: 4
5
50 %
4
50 %
3
0 %
2
0 %
1
0 %
Kundenbewertungen
October 24, 2026
smaller candles inside the larger one are an elegant way to retain the path within the wider move, with optional previous OHLC giving the comparison useful reference points instead of adding entry signals.
October 8, 2026
M1 candles inside an H1 candle keep the little moves and the bigger picture together. Previous OHLC can be added when needed. A handy comparison overlay, with the detail period required to stay smaller than the context period.
October 4, 2026
TradeLens displayed an embedded M1 candle view on EURUSD H1 and XAUUSD H1, M10 and Month1. Three moving averages, timeframe labels and the separator were visible. The invalid M1/M1 combination correctly triggered a clear warning. The interface works well, although low contrast and compressed detail candles can affect readability, especially on higher timeframes.
October 2, 2026
keeping M1 detail inside H1 context is a useful comparison view, with optional previous OHLC references and a clear requirement for the detail period to remain smaller than the larger candle.

Häufig gestellte Fragen (FAQ)
Chart UI Tools
Key Levels
Liquidity Sweep
CHOCH
Inducement
Market Structure
Liquidity Grab
Über den cTrader Store verfügbare Produkte, einschließlich Handelsbots, Indikatoren und Plugins, werden von externen Entwicklern bereitgestellt und nur zu Informations- und technischen Zugriffszwecken verfügbar gemacht. cTrader Store ist kein Broker und erbringt keine Anlageberatung, persönlichen Empfehlungen oder eine Garantie für zukünftige Performance.

Mehr von diesem Autor

Indikator
BOS
CHOCH
+5
Spot market structure shift with ease, overlay timeframes, avoid false breakouts with open close pivots, hide chart bars
Indikator
Volume
Imbalance
+5
Spot Institutional Order Flow with Proportional Volume Bubbles & Integrated Cumulative Volume Delta (CVD) Intelligence.
Indikator
Forex
EURUSD
+5
Fimathe Indicator - Fimathe PCM - Automated Trend Channels & Levels — Ideal for live trading and backteting
„ZigXRay“-Logo
Beste Ratings
4.6
(5)
$29
/
$49
Indikator
CHOCH
Key Levels
+5
ZigZag Market Structure Identifier - Multi-Layer Scanner: Convergent Pivot Detection, 4-TF Overlay & Naked Chart Mode.
Desktop-Plugin
Risk/Reward
Trade Journal
+5
cTrader Journal - Automatic Trade Capture. Offline Reviews. No Subscription.
„DrbcLevels“-Logo
Beste Ratings
4.0
(4)
$19
/
$29
Indikator
Key Levels
Break & Retest
+5
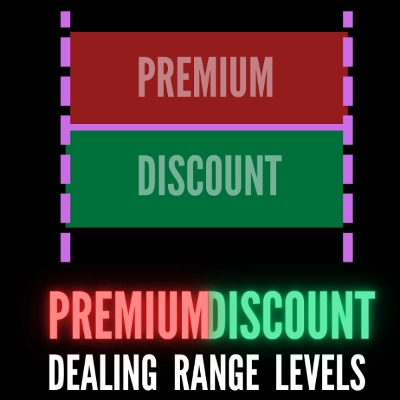
Premium Discount Levels - Professional Dealing Range Zones with Draggable Lines, Alerts, Wartermark & Backtest Mode.
cBot
Fixed Lot
TP Manager
+5
Hotkeys Trading Assistant - Professional Shortcut Assitant with Risk Manager, Hotkeys & Lot Sizing.
„fvg_levels“-Logo
Beste Ratings
4.0
(4)
$19
/
$29
Indikator
Key Levels
Order Block
+5
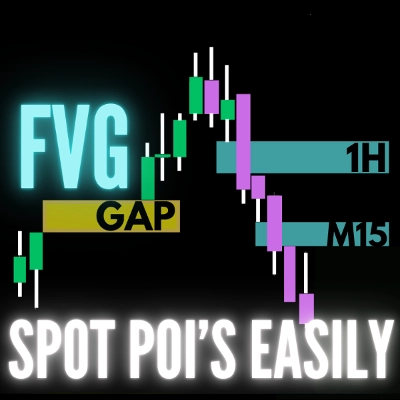
FVG Levels — Auto-Detection of Multi-Timeframe Fair Value Gaps & GAPs, Smart Filters and Liquidity Zone Monitoring

Das könnte Sie auch noch interessieren

Indikator
This indicator can be used to: change color, shape size, position, change font, increase or decrease, and other function
Indikator
Forex
EURUSD
+7
Institutional Session Levels Pro OHLC,Prev(D,W,M OHLC)
Indikator
Supertrend
Moving Average
Adaptive MA anchored to structural trend changes — no fixed period. Dual Supertrend + swing detection.
Indikator
Forex
EURUSD
+3
ATR-normalized MA slope in degrees, comparable across all instruments. Color-coded labels flag strong trend moves.
Indikator
Volume
Key Levels
+1
Session volume profiles from tick volume: POC, value area high and low, and naked POCs extended until touched.
Indikator
Doji
Volume
+5
Instantly spot high-liquidity institutional moves with clean, non-obtrusive triangle alerts on cTrader charts.
Indikator
ADX
ATR
+5
Configure, simulate, and analyze trading strategies with custom filters, multi-target exits, and detailed performance me
Indikator
ATR
Volume
+3
Volume profile key levels - POC, value area, volume peaks and troughs - with break, rejection and retest signals
Indikator
AI
SMC
+5
Coloring trendline/ Colored Trendline / Color Trendline
Indikator
Plot higher-timeframe Bollinger Bands for clearer structure, pullback zones, and breakout signals—without switching char
Indikator
ATR
Prop
+6
🟢 Strength-ranked S/R zones with MTF levels and Pro labels. Nearest-zone band and HUD for faster, cleaner entries. 🔴
Indikator
Doji
Wedge
+5
Angora Pattern Recognition is a cTrader indicator that finds, draws and tracks classic chart patterns automatically.
Indikator
Volume
Liquidity Sweep
+1
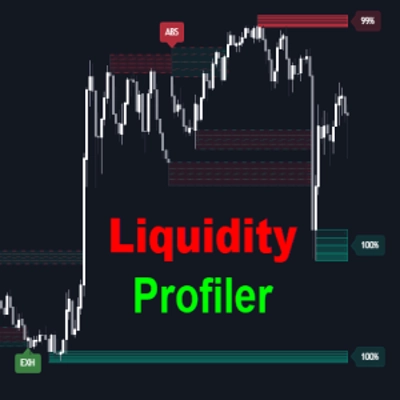
Liquidity Profiler Tools
Indikator
[Hamster-Coder] Pivot Points (Multi Time Frame)
Indikator
Prop
Forex
+9
Trend Sniper — session-based tool highlighting live session ranges and adaptive Custom line.
Indikator
VWAP
Volume
+4
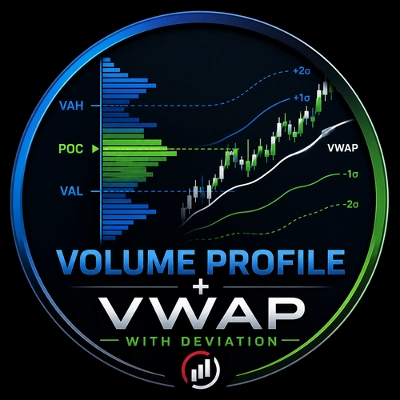
Volume Profile + VWAP with Standard Deviations
Indikator
AI
Grid
+17
Clean 3D, Sleek Candles for Trend Patterns.
Indikator
Forex
BTCUSD
+5
Multi-timeframe moving averages with session lines for structured trend analysis directly on the chart.

Preis

Seit 09/02/2026
29
Verkäufe
179
Kostenlose Installationen