
VWAP Volume Weighted Average Price
インジケーター
バージョン 1.0、Oct 2025
Windows、Mac
4.6
レビュー: 3
説明
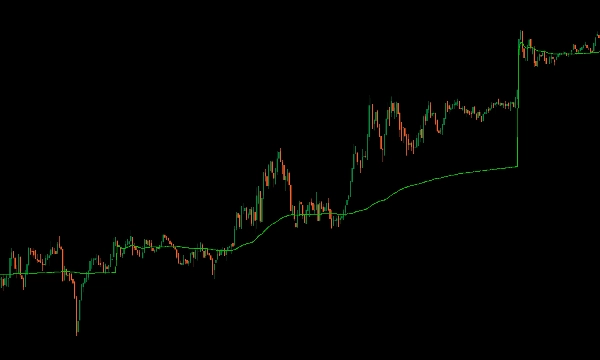
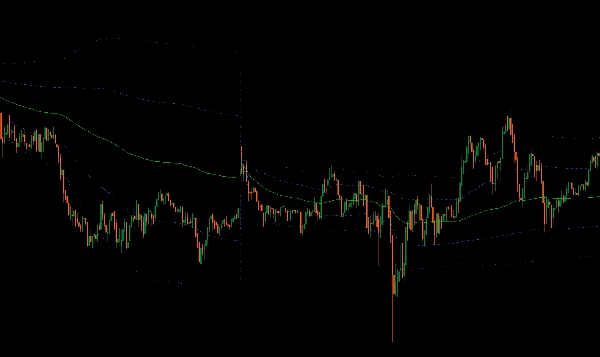
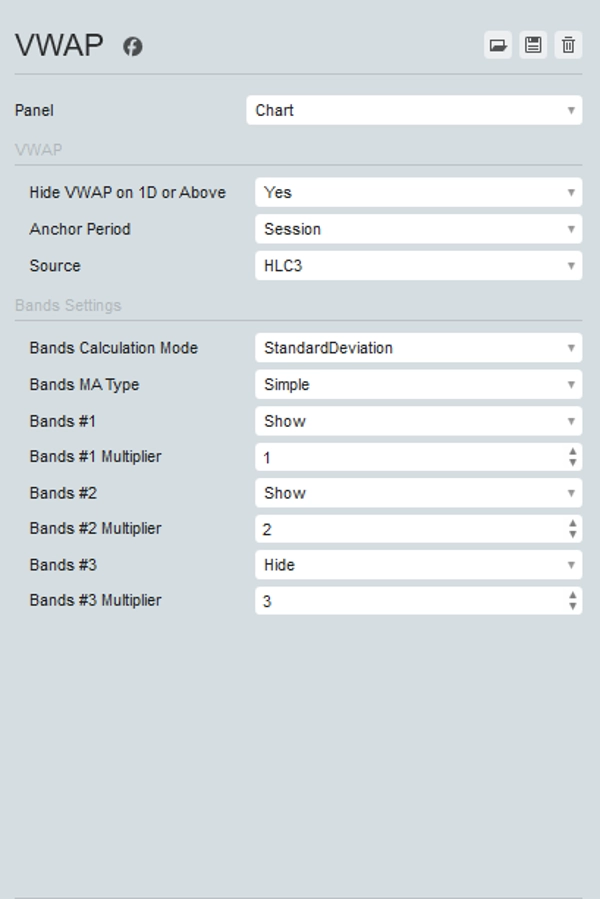
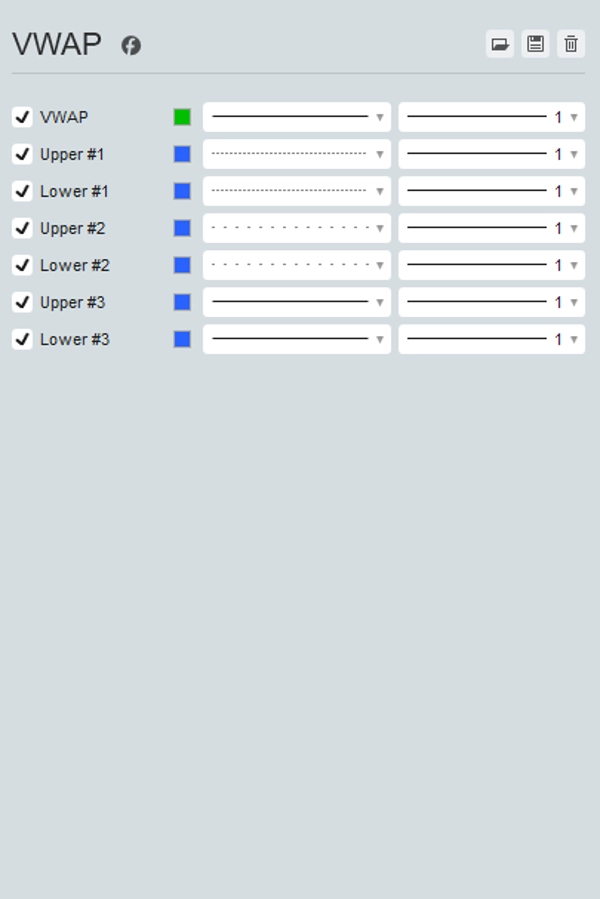
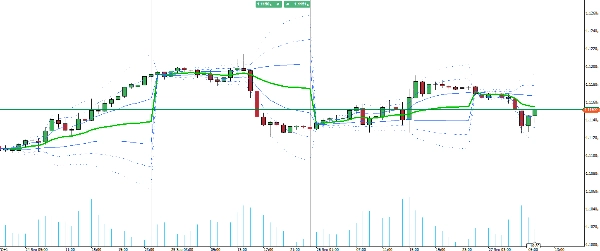
cTrader向けのVWAP インジケーターをご紹介します。TradingViewの出来高加重平均価格の全機能をあなたの取引プラットフォームに提供します。
この包括的なツールでは、アンカーピリオド(セッション、週、月、四半期、年)を選択でき、Open、High、Low、Close、HL2、HLC3、OHLC4、HLCC4などのさまざまな価格ソースから選べます。さらに、最大3つの標準偏差の上限および下限バンドを表示でき、価格分布を完全に把握できます。
VWAPインジケーターはティックデータでリアルタイムに更新され、最も正確でタイムリーな取引判断のための洞察を提供します。cTraderで多機能かつ強力なVWAPインジケーターを使って、取引戦略を向上させましょう。
概要
AIによる概要
The VWAP (Volume Weighted Average Price) indicator for cTrader replicates the full functionality of TradingView's VWAP tool. It allows traders to select anchor periods including Session, Week, Month, Quarter, and Year, and choose from multiple price sources such as Open, High, Low, Close, HL2, HLC3, OHLC4, and HLCC4. The indicator also supports displaying up to three standard deviation bands above and below the VWAP line, providing insights into price distribution and volatility. It updates in real time with tick data, ensuring timely and accurate information for trading decisions. This indicator is applicable across various markets including Forex, Crypto, Stocks, Commodities, and Indices, and supports symbols like BTCUSD, EURUSD, GBPUSD, XAUUSD, NAS100, and USDJPY. It is suitable for strategies involving breakout and scalping techniques.
インジケーターのプロフィール
カスタマーレビュー
4.6
レビュー: 3
5 | 67 % | |
4 | 33 % | |
3 | 0 % | |
2 | 0 % | |
1 | 0 % |
カスタマーレビュー
October 27, 2025
Solid enough as a backup opinion. Win rate means less without average R.
October 22, 2025
it earns a spot because the trade idea gets a pause before execution. A clean signal can still fail.
October 19, 2025
The idea is fine, just do not expect it to print perfect entries, and The result needs a journal.
ディスカッション
よくあるご質問
BTCUSD
Forex
Breakout
Indices
EURUSD
Commodities
GBPUSD
NZDUSD
Prop
Scalping
Crypto
Stocks
XAUUSD
NAS100
USDJPY
VWAP
cTrader Storeで入手可能な取引ボット、インジケーター、プラグインなどの商品は、第三者の開発者が提供するものであり、情報と技術の取得のみを目的としてご利用いただけます。cTrader Storeはブローカーではなく、投資助言や個人的な推奨を行うことも、将来のパフォーマンスを保証することもありません。


![「[CB] Pivot Points Pro」ロゴ](https://cdn.ctrader.com/image/webp/43463c82-67b0-4f10-a4ba-901bba091d81_32594)
![「Smart Money Concepts (SMC) [Iridio Capital]」ロゴ](https://cdn.ctrader.com/image/webp/28b69fd1-ef54-4bed-9487-07e78e883be4_40934)


![「[Hamster-Coder] Pivot Points MTF」ロゴ](https://cdn.ctrader.com/image/webp/4c143e5a-309c-40e3-a578-f04d1e133ffa_31159)


価格
登録日 25/09/2025
25
販売
331
無料インストール