
AsiaSession
Indicador
225 descargas
Versión 1.0, Dec 2025
Windows, Mac
Descripción
📜 Descripción
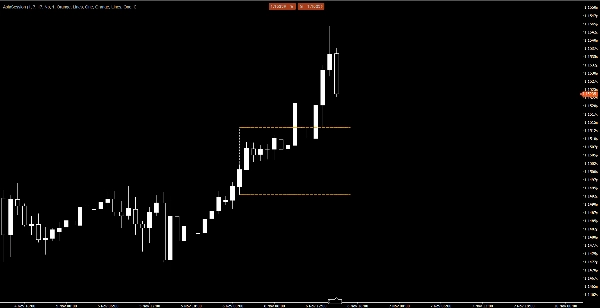
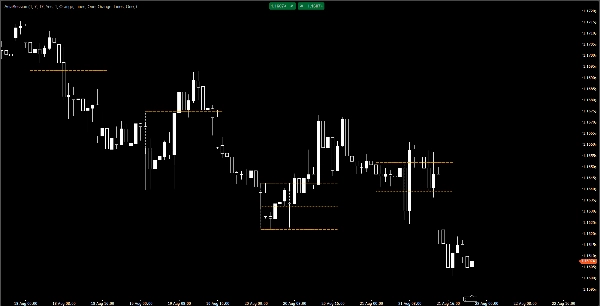
AsiaSession Indicator es una herramienta personalizada para la plataforma cTrader que resalta el rango de la sesión de trading asiática. Dibuja un cuadro completo de la sesión con límites verticales para las horas de inicio y fin, y líneas horizontales para los niveles alto, bajo y medio. Esto lo hace especialmente útil para los traders que aplican Smart Money Concepts (SMC) y estrategias ICT, donde los niveles de la sesión asiática a menudo actúan como zonas de liquidez.
✨ Características clave
- Dibuja un cuadro completo de la sesión:
-
- Línea izquierda (inicio de sesión)
- Línea derecha (fin de sesión)
- Línea superior (máximo de Asia)
- Línea inferior (mínimo de Asia)
- Línea media (medio de Asia)
- Extiende las líneas alto/bajo/medio hacia el futuro hasta una hora definida por el usuario
- Colores, estilos y grosor configurables para cada línea
- Opción para mostrar solo el día actual o incluir sesiones históricas
- Parámetro incorporado de desplazamiento UTC para ajustes de zona horaria
- Salta automáticamente los fines de semana para evitar sesiones falsas
- Arquitectura limpia y orientada a objetos con enums, helpers, modelos y servicios
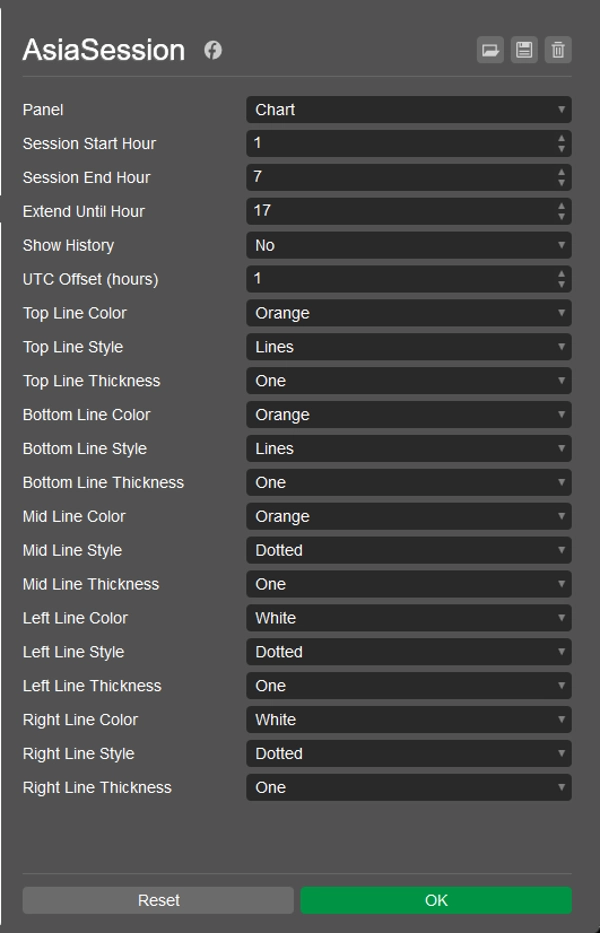
⚙️ Parámetros
- Hora de inicio / Hora de fin de sesión – define los límites de la sesión asiática
- Extender hasta la hora – controla cuánto tiempo se extienden las líneas hacia el futuro
- Mostrar historial – alterna los cuadros de sesiones históricas
- Desplazamiento UTC – ajusta a tu zona horaria local o al tiempo del servidor del broker
- Personalización de líneas – establece color, estilo y grosor para cada límite
📈 Uso
- Instala el indicador en cTrader Automate.
- Adjúntalo a tu gráfico.
- Ajusta los parámetros para que coincidan con tu zona horaria y preferencias de trading.
- Activa Mostrar historial para visualizar sesiones pasadas.
📦 Licencia
Publicado bajo la Licencia MIT – libre para usar, modificar y distribuir.
Resumen
Resumen de IA
AsiaSession is a custom indicator for the cTrader platform designed to visualize the Asian trading session range. It draws a complete session box on the chart, including vertical lines marking the session start and end times, and horizontal lines indicating the session’s high, low, and mid levels. These lines can be extended into the future up to a user-defined time. The indicator supports customizable colors, styles, and thickness for each line, allowing traders to tailor the display to their preferences.
Key parameters include session start and end hours, extension duration for the lines, an option to show historical sessions or only the current day, and a built-in UTC offset for timezone adjustments. The indicator automatically skips weekends to avoid displaying false sessions. Its architecture is object-oriented, facilitating clean and efficient operation.
AsiaSession is particularly useful for traders applying Smart Money Concepts (SMC) and ICT strategies, where Asian session levels often serve as liquidity zones. Installation involves adding the indicator to cTrader Automate and configuring parameters to match the trader’s timezone and preferences. The product is published under the MIT License, permitting free use, modification, and distribution.
Perfil del indicador
Valoraciones de clientes
0.0
Valoraciones: 0
Valoraciones de clientes
Este producto todavía no se ha valorado. ¿Ya lo ha probado? Sea el primero en informar a otros.
Conversación
Preguntas frecuentes
Forex
EURUSD
SMC
Los productos disponibles a través de cTrader Store, incluidos bots, indicadores y plugins para operar, son proporcionados por desarrolladores de terceros y están disponibles únicamente con fines informativos y de acceso técnico. cTrader Store no es un bróker, por lo que no proporciona asesoramiento de inversión, recomendaciones personales ni ninguna garantía de rentabilidad futura.
Más de este autor


![Logotipo de "High-Low Divergence [Iridio Capital]"](https://cdn.ctrader.com/image/webp/443c4661-7abb-40f1-842f-4b6ec560649b_40914)


Precio
Desde 24/09/2025
368
Instalaciones gratis