
Descripción
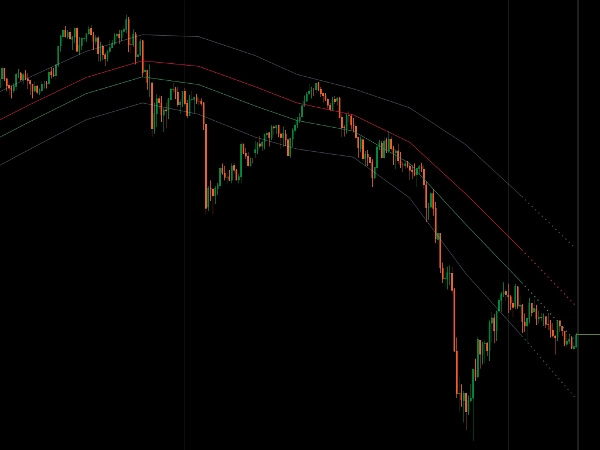
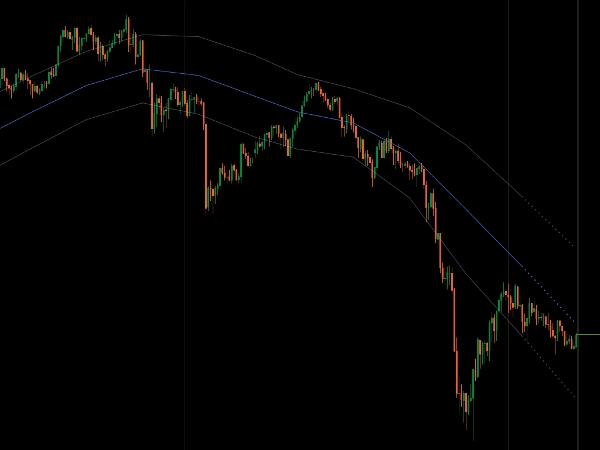
Canal de precio dinámico usando medias móviles en los cuatro precios OHLC para un análisis completo de la estructura del mercado.
Aplica el tipo de MA que elijas (Simple, Exponencial, Wilder, Escalado por Desviación, SuperSmoother, Hull) a los límites Alto/Bajo, sesgo direccional de Apertura/Cierre y línea de equilibrio Mediana para una visualización cohesiva del canal.
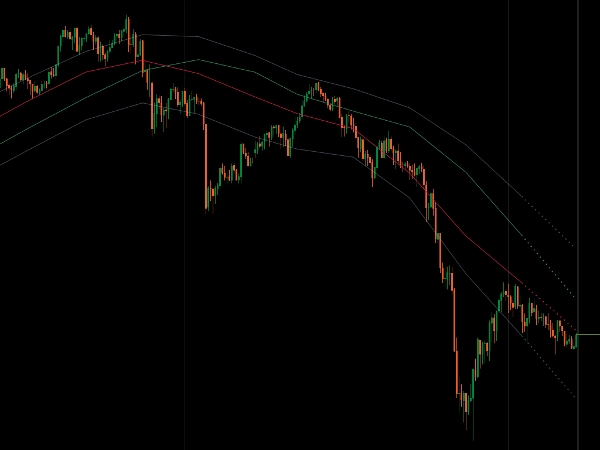
Zonas de reversión Fibonacci integradas (38.2%, 61.8%), capa dual de suavizado para SMA/EMA creando canales ultra limpios, visualización multitemporal con modos tradicionales de escalera o líneas de tendencia diagonales, proyecciones inteligentes basadas en momentum y detección de rechazo de límites que ofrecen una estructura completa del canal para traders que buscan reversión a la media y evaluación de la fuerza de la tendencia en diferentes marcos temporales.
CARACTERÍSTICAS
Estructura Completa de Precios
- Alto/Bajo definen los límites del canal
- Apertura/Cierre muestran el sesgo direccional
- Línea mediana: nivel 50% entre Alto/Bajo—el verdadero centro del equilibrio del mercado
- Cuatro precios trabajando juntos para mostrar una imagen completa del mercado
Zonas de Reversión Integradas
- Niveles Fibonacci 38.2% y 61.8% marcan áreas de retroceso estadísticamente significativas
- Zonas dinámicas que se adaptan al movimiento del precio
- Puntos claros de referencia para entrada y salida
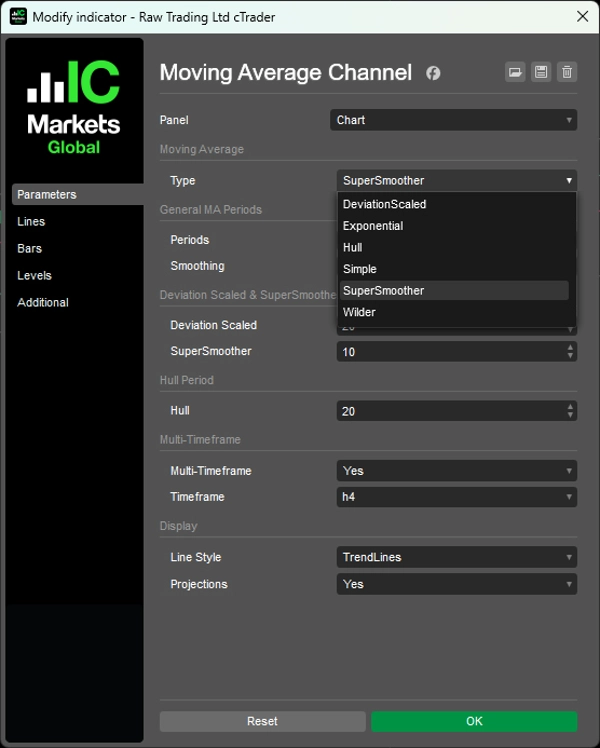
6 Tipos de Medias Móviles
- Simple, Exponencial, Wilder, Escalado por Desviación, SuperSmoother, Hull
- Doble suavizado para SMA/EMA: Periodo + capa adicional de suavizado para canales ultra limpios
- Algoritmos avanzados: Escalado por Desviación se adapta a la volatilidad, SuperSmoother elimina el retraso, Hull enfatiza la acción reciente del precio
Multitemporal con Líneas de Tendencia
- Ver el canal de un marco temporal superior en gráficos de marcos temporales inferiores
- Dos modos de visualización: líneas tradicionales en escalera o líneas de tendencia diagonales (solo MTF)
- Las líneas conectan cierres de barras MTF para una estructura diagonal limpia
- Proyecciones inteligentes muestran hacia dónde se dirige el canal basado en el momentum actual
Sistema Visual Limpio
- La pendiente del canal muestra el momentum
- La posición del precio muestra la fuerza de la tendencia
- Los rechazos de los límites señalan posibles reversiones
- Un indicador para un análisis completo de la estructura del mercado
__________________________________________________________________________________________
MÁS INDICADORES GRATUITOS
Explora una amplia gama de herramientas de análisis de mercado—desde estructura y volumen hasta regresión, volatilidad y marcos temporales personalizados.
El código fuente está disponible en el repositorio de GitHub repository.
Todos son gratuitos para usar. Pero si quieres apoyar con un café, puedes hacerlo aquí.
Soporte/Resistencia
Volumen
- Perfilador de Actividad de Volumen
- Analizador de Eficiencia de Volumen
- Análisis de Perfil de Volumen
- Perfil de Volumen - Actualizado
- Análisis de Distribución de Volumen
- VWAP (Precio Promedio Ponderado por Volumen)
Medias Móviles
- Canal SSL
- Media Móvil Anclada
- Media Móvil Escalada por Desviación
- Activador Gann Alto Bajo
- Línea de Tendencia Instantánea
- Media Móvil Adaptativa Kaufman con Visión de Tendencia
- Canal de Media Móvil
- Suite de Medias Móviles
- Media Móvil de Canal de Tendencia
Utilidades/Personalizados
Basado en Regresión
Volatilidad
Osciladores
__________________________________________________________________________________________
DESCARGO DE RESPONSABILIDAD
El trading implica riesgos. Este indicador está destinado solo para análisis técnico — siempre aplica una gestión adecuada del riesgo y opera con responsabilidad.
RETROALIMENTACIÓN Y MEJORAS
Si tienes sugerencias, solicitudes de funciones o ideas para mejoras, por favor deja un comentario en la pestaña de Discusión. Tu retroalimentación ayuda a mejorar el indicador para todos.
Resumen
The indicator incorporates built-in Fibonacci reversion zones at 38.2% and 61.8%, which dynamically adjust with price movement to highlight significant pullback areas and provide clear entry and exit reference points. It supports multi-timeframe analysis, allowing higher timeframe channels to be displayed on lower timeframe charts, with two visualization modes: traditional stairstep lines or diagonal trendlines connecting multi-timeframe bar closes. Smart momentum-based projections indicate potential channel direction, while boundary rejection detection signals possible reversals.
This tool offers a cohesive visual system where channel slope reflects momentum and price position indicates trend strength, enabling traders to assess trend direction, momentum shifts, and mean reversion zones across various markets including Forex, Indices, Commodities, Crypto, and Stocks.


