
Deskripsi
📈 Signal Moving Average 📉
The Signal Moving Average adalah indikator yang menggabungkan Simple Moving Average (SMA) dengan perhitungan korelasi dinamis untuk lebih menyesuaikan dengan kondisi pasar. 🎯 Indikator ini menyesuaikan sensitivitasnya berdasarkan kekuatan tren, menjadikannya alat yang kuat untuk mengidentifikasi tren dan menyaring kebisingan pasar. 🌟
Fitur Utama 🔑
📊 Adjusted Moving Average:
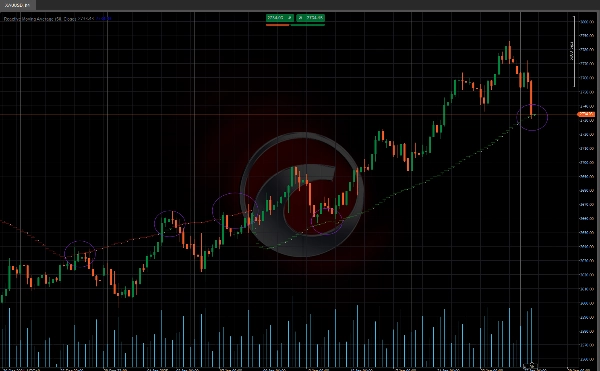
- Garis moving average secara dinamis menyesuaikan berdasarkan korelasi antara harga dan waktu.
- Di pasar dengan tren kuat, moving average bergerak lebih cepat mengikuti harga. 🚀
- Di pasar yang bergerak menyamping, moving average tetap lebih stabil, mengurangi sinyal palsu. 🛑
🔢 Perhitungan Korelasi:
- Indikator menghitung korelasi antara harga dan waktu menggunakan formula Pearson.
- Indikator menyesuaikan moving average berdasarkan koefisien determinasi (R²). 🧮
👀 Visualisasi:
- Tampilan yang jelas dan intuitif untuk interpretasi yang mudah. 📉📈
Cara Menggunakan Indikator 🛠️
🔍 Identifikasi Tren:
- Tren Bullish: Ketika harga berada di atas moving average yang berkorelasi. 🐂
- Tren Bearish: Ketika harga berada di bawah moving average yang berkorelasi. 🐻
✅ Konfirmasi Sinyal:
- Gunakan moving average yang disesuaikan sebagai level support atau resistance dinamis. 🛡️
- Gabungkan indikator ini dengan alat teknikal lain untuk mengonfirmasi sinyal. 🔄
Penyesuaian Moving Average ⚙️
Algoritma menyesuaikan moving average berdasarkan nilai R²:
- Jika R² > 0.5 (korelasi signifikan):
-
- Moving average disesuaikan menggunakan kombinasi berbobot antara nilai SMA saat ini dan nilai sebelumnya dari moving average yang disesuaikan (_ma).
- Pembobotan bergantung pada nilai R². ⚖️
- Jika R² ≤ 0.5 (korelasi tidak signifikan):
-
- Moving average disesuaikan dengan mengurangi nilai yang proporsional terhadap selisih absolut antara nilai SMA saat ini dan nilai sebelumnya dari moving average yang disesuaikan. 🔄
- Indikator Toko Ctrader:
Dynamic Market Structure
Analysis of Turning Points
Fibonacci Linear
Regression Multi-timeframe
Multi-Level Candle Bias
Tracker
Auto Support and
Resistance Trend Lines
Ringkasan
Ulasan pelanggan
5 | 100 % | |
4 | 0 % | |
3 | 0 % | |
2 | 0 % | |
1 | 0 % |


