

Divergency_withSourceCode
Indicator
17 downloads
Version 1.0, Apr 2025
Windows, Mac


Since 11/01/2025
375
Free installs
Description
Summary
AI summary
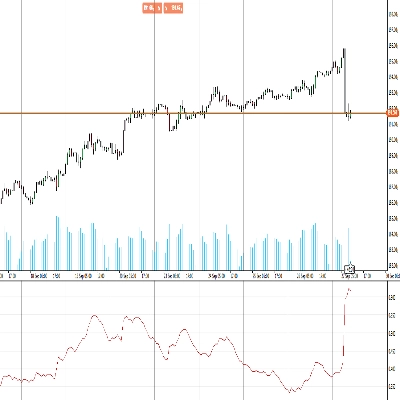
The Divergency_withSourceCode indicator for cTrader is a customizable tool designed to detect divergences and trend continuation patterns using multiple oscillators and fractal analysis. It supports 12 oscillators, including Chande Momentum, RSI, MACD, and Stochastic, allowing users to select and adjust oscillator settings such as period, smoothing, signal line, and moving average type.
The indicator identifies regular divergences (price makes higher highs/lower lows while oscillator does not), hidden divergences (oscillator makes higher highs/lower lows while price does not), and correlation patterns where price and oscillator move together. It uses fractal detection to find significant highs and lows in the oscillator based on a configurable fractal period.
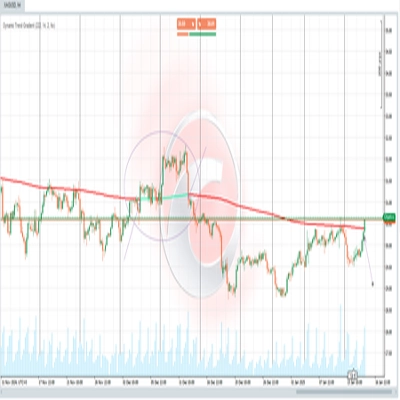
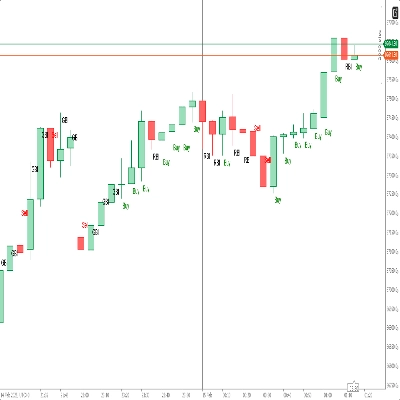
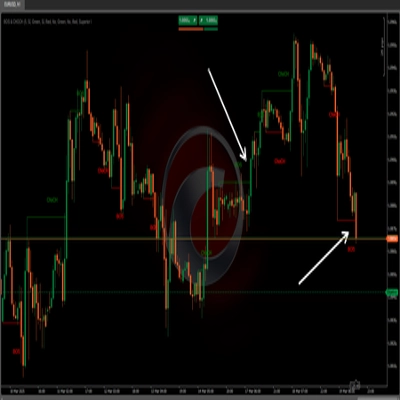
Visual outputs include color-coded trend lines and markers displayed both on the chart and in a separate indicator window below the chart. Signals are shown as arrows or colored dots indicating bullish, bearish, hidden divergence, and correlation signals. Reference levels at 30 (oversold), 50 (mid), and 70 (overbought) are included.
Users can customize divergence detection parameters such as lookback periods and bar validation ranges to tailor signal sensitivity. The indicator is suitable for versatile divergence analysis across different markets and timeframes. Full source code is included for further customization.
The indicator identifies regular divergences (price makes higher highs/lower lows while oscillator does not), hidden divergences (oscillator makes higher highs/lower lows while price does not), and correlation patterns where price and oscillator move together. It uses fractal detection to find significant highs and lows in the oscillator based on a configurable fractal period.
Visual outputs include color-coded trend lines and markers displayed both on the chart and in a separate indicator window below the chart. Signals are shown as arrows or colored dots indicating bullish, bearish, hidden divergence, and correlation signals. Reference levels at 30 (oversold), 50 (mid), and 70 (overbought) are included.
Users can customize divergence detection parameters such as lookback periods and bar validation ranges to tailor signal sensitivity. The indicator is suitable for versatile divergence analysis across different markets and timeframes. Full source code is included for further customization.
Indicator profile
Discussion
Customer reviews
0.0
Reviews: 0
Customer reviews
No reviews for this product yet. Already tried it? Be the first to tell others!
FAQ
Signal
RSI
ATR
MACD
Products available through cTrader Store, including trading bots, indicators and plugins, are provided by third-party developers and made available for informational and technical access purposes only. cTrader Store is not a broker and does not provide investment advice, personal recommendations or any guarantee of future performance.






Price
Since 11/01/2025
375
Free installs