present
新規登録で初回購入時に$50オフ
Trading product for RSI Indicator インジケーター SMA RSI, image 1
RSI Indicator
インジケーター
バージョン 1.0、May 2026
Windows、Mac
Trading product for RSI Indicator インジケーター SMA RSI, image 2
Trading product for RSI Indicator インジケーター SMA RSI, image 3
95
販売
171
無料インストール

説明

ショーケース:


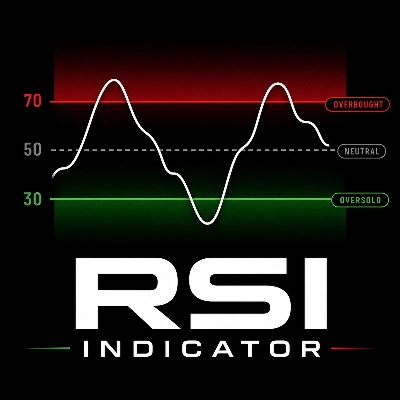
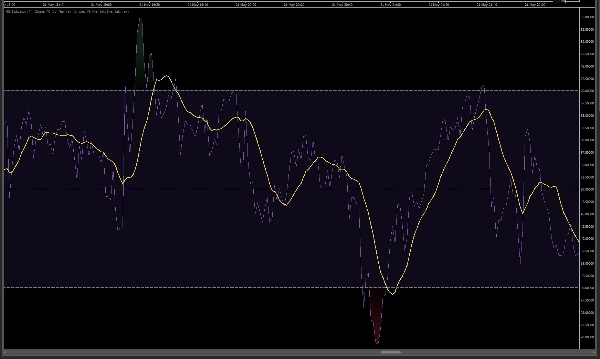
RSIインジケーター - このインジケーターは、cTraderプラットフォーム向けのクラシックな相対力指数(RSI)オシレーターの高度でありながらシンプルな実装です。TradingViewのオリジナルインジケーター(公式仕様に基づく)に厳密に準拠して開発されています。

RMA(ランニング移動平均)平滑化モデルの使用により、このインジケーターはTradingViewの対応物とまったく同じ動作と描画を行います。また、完全に一致する視覚的体験も保証しています。

主な特徴と機能:

  • 100% TradingView互換: アルゴリズムはオリジナルのTVインジケーターとまったく同じ計算ロジック(RMA式に基づく)を使用しています。
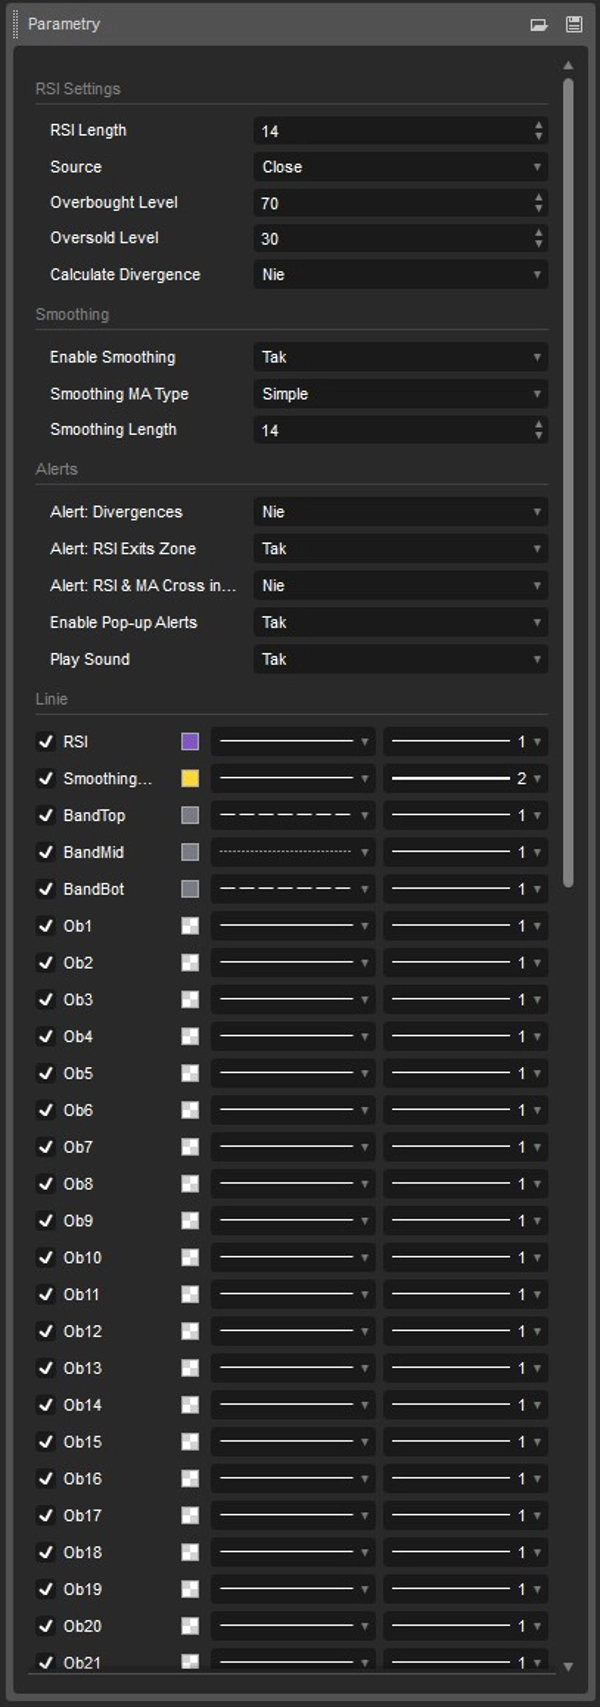
  • 見事なビジュアルデザイン(動的グラデーション): 革新的な30段階のカラ―シェーディングシステムが適用されています。RSIが買われ過ぎゾーン(70以上)に上昇するほど赤い背景が強くなり、売られ過ぎゾーン(30以下)に下落するほど緑が深くなります。中間域はクラシックな紫色のトーンを維持します。
  • 内蔵移動平均(MA): 最新のTVバージョンと同様に、RSIラインを平滑化しオシレーター内のトレンドを識別するための移動平均線(例:SMA)を有効にできます。
  • 自動ダイバージェンス検出: インジケーターはチャート上で定期的なダイバージェンスを自動的にスキャンします。価格とRSIトレンド強度の不一致を検出すると、インジケーターウィンドウ内に直接ラインとマーカー(強気:緑、弱気:赤)を描画します。
  • 強力なアラートシステム(ポップアップ&サウンド): 常に最新情報を受け取れます。インジケーターは以下の際に通知します:
    • RSIが買われ過ぎ/売られ過ぎゾーンを抜けると(クラシックな買い/売りシグナルを生成)、
    • RSIラインがこれらのゾーン内でMAラインをクロスすると、
    • 新しいダイバージェンスが検出されると。

このインジケーターは誰のため?

TradingViewでRSIを分析することに慣れていて、cTraderで完全に一致するシグナルを探し、手動で色を調整することなくクリーンで視覚的に魅力的なデザインを重視する方に最適なソリューションです。

使いやすく、正確に動作し、オリジナルに忠実!

cGuru

概要

AIによる概要
The RSI Indicator is a cTrader implementation of the classic Relative Strength Index oscillator, designed to replicate TradingView’s original indicator using the Running Moving Average (RMA) smoothing method. It provides 100% calculation compatibility with TradingView, ensuring identical signal behavior and visual presentation. Key features include a dynamic 30-level gradient color scheme that visually distinguishes overbought (red) and oversold (green) zones, with a neutral purple mid-range. The indicator supports an optional moving average line (e.g., SMA) to smooth the RSI curve and highlight trends within the oscillator. It also offers automatic detection of regular divergences between price and RSI trends, marking bullish and bearish divergences directly on the chart. A built-in alert system notifies users via pop-up and sound when the RSI exits overbought/oversold zones, crosses the moving average within these zones, or when new divergences are detected. This indicator is suitable for traders familiar with TradingView’s RSI who seek an accurate, visually clear, and feature-rich RSI tool within the cTrader platform.
インジケーターのプロフィール
インジケーターのカテゴリー
サポート&レジスタンス
出力の種類
ビジュアル表示
データ要件
ティックデータ
サポート対象のシグナル
反転
ダイバージェンス

カスタマーレビュー

0.0
レビュー: 0
カスタマーレビュー
この商品にはまだレビューがありません。お使いになったことがある方は、ぜひレビューをお願いします。

ディスカッション

よくあるご質問

SMA
RSI
Moving Average
cTrader Storeで入手可能な取引ボット、インジケーター、プラグインなどの商品は、第三者の開発者が提供するものであり、情報と技術の取得のみを目的としてご利用いただけます。cTrader Storeはブローカーではなく、投資助言や個人的な推奨を行うことも、将来のパフォーマンスを保証することもありません。

この作成者の他の商品

インジケーター
AI
ATR
+27
Trend Is Your Friend cBot - INDICATOR - Professional Grid, Pyramid, Swing & Scalp Trading Indicator
インジケーター
AI
ATR
+27
Supertrend Indicator
インジケーター
AI
ATR
+27
Nadaraya-Watson Envelope Indicator
インジケーター
AI
ATR
+27
Supertrend Indicator
インジケーター
AI
ATR
+26
MacD Custom Indicator-Multiple Time Frame
cBot
AI
ATR
+27
RSI Simple Grid cBot - grid trading strategy with RSI (Relative Strength Index) signals
26.8%
ROI
4.41
プロフィットファクター
インジケーター
AI
ATR
+27
Market Cipher B
インジケーター
AI
ATR
+19
Market Cipher A
cBot
AI
ATR
+27
SmartHedge cBot - Your Trading Companion
1.26
プロフィットファクター
cBot
ATR
RSI
+5
Trend is your friend cBot - Professional Grid, Pyramid, Swing & Scalp Trading System
28%
ROI
5.27
プロフィットファクター
インジケーター
EMA
SMA
+3
MACD indicator modeled after TradingView, featuring a 4-color momentum histogram, sound/pop-up crossover alerts.

これも好きかも

インジケーター
SMC
Forex
+5
The only cTrader FVG indicator with Breakaway Gap detection, mitigation tracking, and full multi-asset compatibility.
インジケーター
Pin Bar
Inducement
+5
Institutional Nasdaq Session Liquidity Map with Live Point HUD, Sweep Alerts & Interactive Playbook.
インジケーター
Triangle
Double Top
+5
Know which liquidity sweeps are real. Auto-tracks EQH/EQL and confirms genuine reversals, not just broken levels.
インジケーター
Candle Timer & Strength Panel for cTrader Description: Candle Timer & Strength Panel is an advanced, always-visible over
インジケーター
Flag
VWAP
+5
Session VWAP with statistical deviation bands, gradient cloud, and live rejection alerts — see exactly how stretched pri
インジケーター
MCDX is a powerful and innovative indicator.
「Zigzag Trend」ロゴ
トップ評価
4.5
(4)
$25
/
$45
インジケーター
AI
ATR
+23
The ZigZag Trend is a market structure tool that filters out small price fluctuations and highlights major swing.
インジケーター
Prop
Forex
+7
The Parabolic SAR, or "Stop and Reverse," is a dynamic technical analysis tool.
インジケーター
BOS
CHOCH
+5
A professional-grade cTrader indicator for traders following the Inner Circle Trader (ICT) methodology.
インジケーター
MSS
AI-assisted
+5
Live ICT Silver Bullet detection: liquidity sweeps, structure shifts, and killzone-gated FVGs, graded and glowing in rea
インジケーター
MACD
Prop
+8
NTNPICLL is a tool to check the best trading hours for the assets and also includes the highest and lowest point
「QX TradeDecision」ロゴ
トップ評価
4.5
(4)
$20
/
$22
インジケーター
ATR
Flag
+5
Decision panel with Buy/Sell scores, market bias, setup quality, trading cost and clear trade reasons.
インジケーター
ATR
RSI
+8
Multi-timeframe market-state dashboard: Score (-100..+100) + UP/NEUT/DN per TF, with optional closed-candle arrows.
インジケーター
Prop
Forex
+13
Volume Meter
インジケーター
Forex
cTrader Auto Support & Resistance detects key levels with Fibonacci analysis and sends real-time trading alerts.
インジケーター
Alpha Sentiment Pro - See the Market's Pulse Before It Moves
インジケーター
Prop
Scalping
Shows bars from different Time Frame on zoom out and hides the current bars. Perfect tool for Multi TF "Market Reply"
インジケーター
Prop
Forex
+5
Transform your approach to trading with our innovative Pivot Point Indicator.

価格

95
販売
171
無料インストール