
Beschreibung
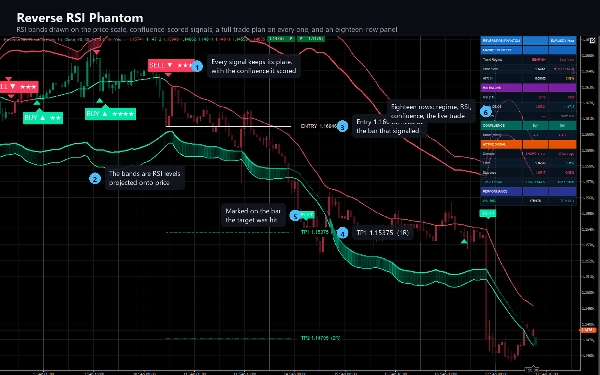
Reverse RSI Phantom kehrt den RSI um. Anstatt den Oszillator in einem Bereich unter dem
Chart zu zeichnen, löst er die RSI-Formel rückwärts und stellt eine andere Frage: Welcher Preis würde den
RSI genau auf 70 setzen, und welcher Preis würde ihn auf 30 setzen? Diese beiden Preise werden als
Bänder im Chart dargestellt und bewegen sich mit jedem Balken.
Diese eine Änderung bringt den gesamten Oszillator auf die Preisskala, wo Sie ihn gegen die
Kerzen, gegen Ihre Levels und gegen den Plan sehen können, den der Indikator für Sie zeichnet.
WAS ER ZEICHNET
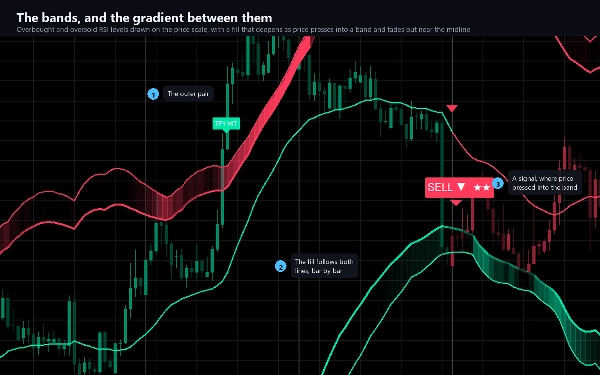
- Zwei Bänder und deren äußere Kanten, bei den von Ihnen gewählten überkauften und überverkauften Levels, projiziert auf
den Preis und optional geglättet.
- Eine Farbverlauffüllung innerhalb jedes Bandes, die sich vertieft, wenn der Preis darauf drückt, und nahe der Mittellinie vollständig verblasst,
sodass der Chart Ihnen ohne eine einzige Zahl zeigt, wo der Druck liegt.
- Eine Mittellinie, die die Trendregime-Farbe trägt.
- Kerzen, die von demselben Regime getönt sind, sodass die Richtung auf einen Blick lesbar ist.
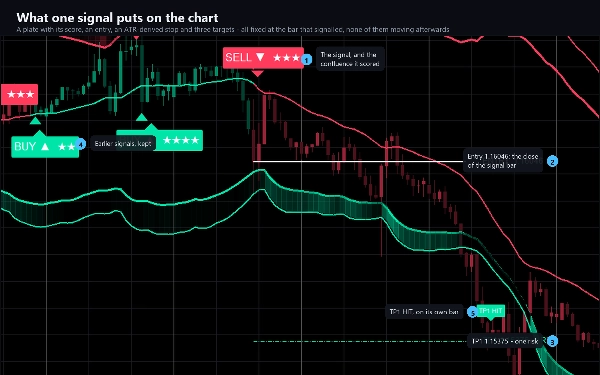
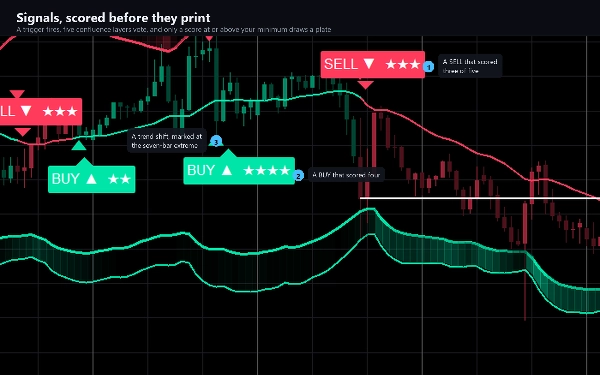
- Eine Tafel auf jedem Signalbalken - KAUF oder VERKAUF - mit der erreichten Übereinstimmung von fünf möglichen.
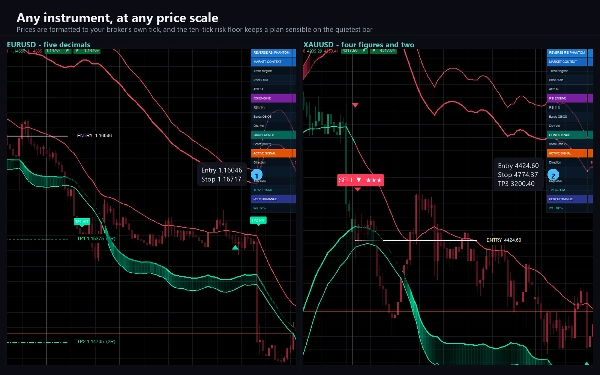
- Ein kompletter Handelsplan auf dem Signalbalken: der Einstieg, ein ATR-abgeleiteter Stopp und drei Ziele bei den von Ihnen festgelegten Risiko-Multiplikatoren. Fünf Linien und fünf Preisschilder, alle fixiert auf dem signalisierenden Balken.
- Eine Tafel auf dem Balken, der jedes Ziel erreicht, und auf dem Balken, der den Stopp berührt.
- Dreiecke, wo das Trendregime sich dreht, und Markierungen, wo der RSI vom Preis divergiert.
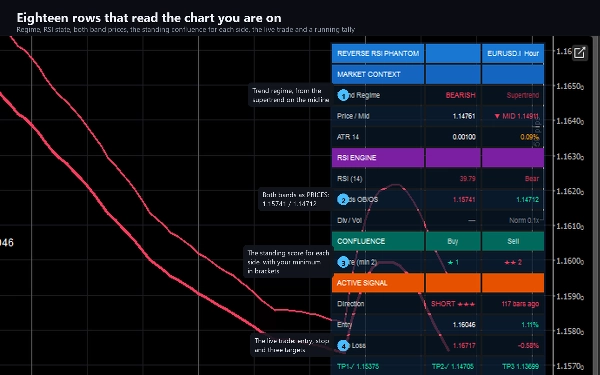
- Ein achtzehnzeiliger Bereich: Regime, Preis gegen die Mittellinie, ATR, RSI und dessen Zustand, beide Bänder als
Preise, Divergenz, Volumen, die aktuelle Übereinstimmung für jede Seite, der laufende Handel mit Einstieg,
Stopp und drei Zielen sowie eine laufende Bilanz dessen, was die Chart-Historie gemacht hat.
WIE ER ENTSCHEIDET
Ein Signal ist nicht eine einzelne Bedingung. Ein Auslöser feuert – das Regime dreht sich, der Preis kreuzt ein Band oder eine
Divergenz bestätigt – und dann stimmen fünf Übereinstimmungsebenen ab: das Regime, eine RSI-Bestätigung, ein Band-Retest, eine Divergenz und eine Volumenprüfung. Die Punktzahl reicht von 0 bis 5, wird als Sterne auf der Tafel angezeigt und
muss das von Ihnen festgelegte Minimum erreichen, bevor etwas gezeichnet wird. Ein Trendtor und ein richtungsabhängiger
Cooldown filtern, was übrig bleibt, und wenn beide Seiten im selben Balken qualifizieren, gewinnt die höhere Punktzahl.
Der Non-Repaint-Modus ist standardmäßig aktiviert: Ein Balken wird erst beurteilt, wenn er geschlossen ist, sodass eine gedruckte Tafel
sich nie bewegt und nie verschwindet.
WICHTIGE EINSTELLUNGEN
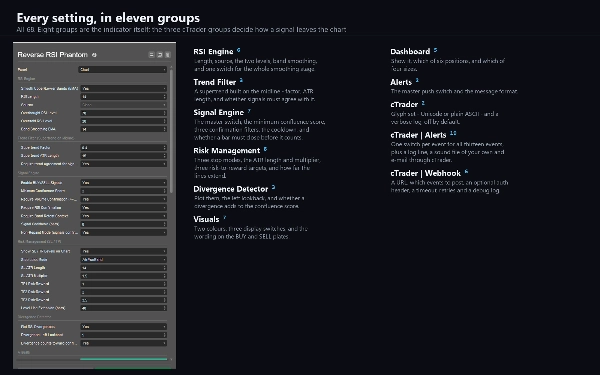
68 in elf Gruppen. RSI-Länge, Quelle und die zwei Levels; Band-Glättung; der Faktor des Supertrend-Filters und ATR-Länge; die minimale Übereinstimmungspunktzahl und drei Bestätigungsfilter; der Signal-Cooldown; drei Stopp-Modi mit ATR-Länge und Multiplikator; drei Risiko-Ertrags-Ziele; der Divergenz-Rückblick; zwei Farben und die Beschriftung auf den Tafeln; die Position und Größe des Panels; und drei nur für cTrader verfügbare Gruppen für Alarme und Webhook.
ALARME UND WEBHOOK
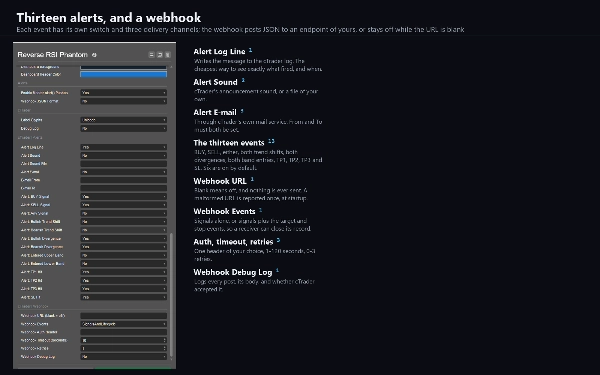
Dreizehn Ereignisse, jeweils mit eigenem Schalter: KAUF, VERKAUF, entweder, beide Trendwechsel, beide Divergenzen,
beide Bandeintritte, alle drei Ziele und der Stopp. Geliefert als cTrader-Protokollzeile, ein Ton Ihrer
Wahl und E-Mail. Nichts feuert, während der Indikator die Chart-Historie durchläuft, und nichts feuert in
einem Backtest.
Ein Webhook sendet dieselben Ereignisse als JSON an jede von Ihnen gewählte Adresse – einen Trading-Bot, ein Journal, ein
Relay, einen Automatisierungsfluss. Er bleibt aus, bis Sie eine Adresse eingeben, wird pro Ereignis pro Balken dedupliziert,
ist auf zwanzig Nachrichten pro Minute begrenzt und ein Fehler wird protokolliert, anstatt geworfen zu werden. Er sendet
über den eigenen Netzwerkdienst von cTrader, weshalb der Indikator keinerlei Datei- oder Netzwerkzugriffsrechte benötigt.
TYP UND FENSTER
Ein Overlay-Indikator: Alles wird auf dem Preischart gezeichnet, und es wird kein separater Bereich hinzugefügt.
ZEITRAHMEN UND INSTRUMENTE
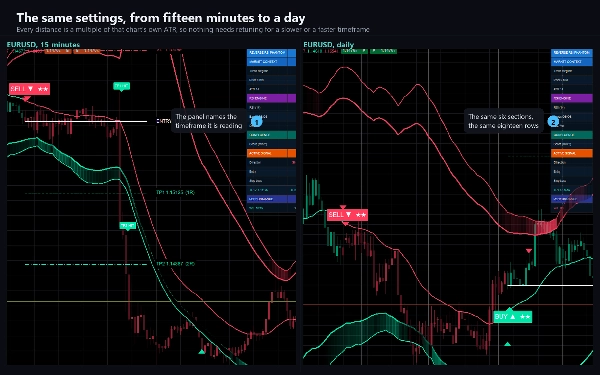
Beliebig. Jede Distanz, die er zeichnet, ist ein Vielfaches des ATR des jeweiligen Charts, und die Preise sind auf den Tick Ihres Brokers formatiert, sodass nichts zwischen einem 15-Minuten-Chart und einem Tageschart oder
zwischen einem FX-Paar mit fünf Dezimalstellen und Gold mit vier Stellen neu eingestellt werden muss. M15 bis H4 ist der Bereich, auf dem die meisten Tests durchgeführt wurden.
Volumen ist erforderlich: Eine der fünf Übereinstimmungsebenen liest es aus.
ANWENDUNGSFÄLLE
- Überkauft- und Überverkauftdruck dort lesen, wo er hingehört, auf der Preisskala.
- Mean-Reversion-Einstiege an einem Band mit dem Trendregime als Filter vornehmen.
- Ein Signal in einen Plan verwandeln: ein Stopp und drei Ziele, vor dem Handeln gezeichnet.
- Einen Chart beobachten und per Protokollzeile, Ton, E-Mail oder Webhook informiert werden, wenn etwas passiert.
FÜR WEN ES IST
Trader, die bereits RSI verwenden und ihn dort haben wollen, wo ihre Augen sind, und alle, die ein Signal mit einem Stopp und einer Reihe von Zielen statt einem Pfeil wünschen.
TESTVERSION
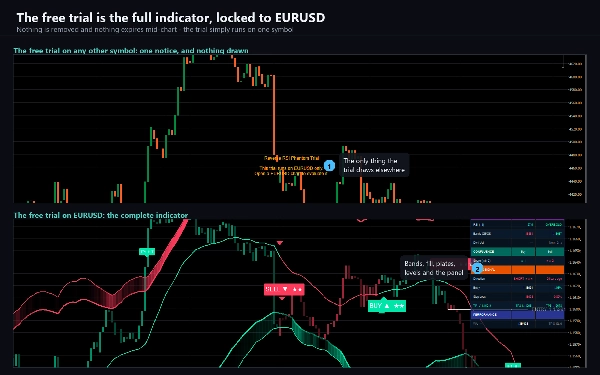
Die kostenlose Testversion ist der vollständige Indikator nur für EURUSD – jeder Broker-Suffix funktioniert. Bei jedem anderen Symbol
zeigt er eine Mitteilung und zeichnet nichts. Keine Zeitbegrenzung, keine reduzierte Historie, keine fehlenden Funktionen. Die Vollversion entfernt die Symbolbeschränkung und ändert sonst nichts.
TECHNISCHE HINWEISE UND EINSCHRÄNKUNGEN
Zugriffsrechte: keine. Der Indikator kann keine Dateien lesen, keine Prozesse starten oder eigene Verbindungen öffnen.
Er ist ein Charting- und Analysetool. Er platziert keine Aufträge und hat keinen Zugriff auf Ihr Konto.
Die PERFORMANCE-Zeile des Panels zählt, was auf den Balken passiert ist, die Ihr Chart unter Ihren aktuellen
Einstellungen geladen hat. Es ist eine Beschreibung dieser Historie, kein Backtest und keine Prognose.
Das Ausschalten eines Bestätigungsfilters erhöht die Übereinstimmungspunktzahl, anstatt sie zu senken – drei der
fünf Ebenen vergeben ihren Punkt, wenn ihr Filter deaktiviert ist. Erhöhen Sie die Mindestpunktzahl entsprechend, wenn Sie
Filter ausschalten.
SUPPORT
Fragen werden über den Diskussions-Tab gestellt. Geben Sie Ihren Broker, das Symbol, den Zeitrahmen, die cTrader-Version und
einen Screenshot an, und Sie erhalten beim ersten Mal eine hilfreiche Antwort.
Trading beinhaltet Risiken. Vergangene Leistungen garantieren keine zukünftigen Ergebnisse.
Zusammenfassung
Key features include:
- Two price bands representing RSI thresholds with gradient fills indicating pressure intensity.
- A midline and candle tinting reflecting the current trend regime.
- Confluence-scored BUY and SELL signals displayed on signal bars with a score out of five.
- A comprehensive trade plan per signal, showing entry, an ATR-based stop loss, and three customizable profit targets.
- Visual markers for trend regime changes and RSI-price divergences.
- An 18-row informational panel summarizing regime, ATR, RSI states, volume, confluence, active trades, and historical performance.
- Configurable settings covering RSI parameters, smoothing, trend filters, confluence thresholds, stop modes, risk targets, divergence lookback, and alert/webhook options.
The indicator operates as an overlay on any instrument and timeframe, requiring volume data for full functionality. Alerts and webhooks can notify users of key events such as signals, trend shifts, targets, and stops. Non-repaint mode ensures signals are fixed once bars close. It is designed for traders who use RSI and seek integrated signals with trade management guidance.
Kundenbewertungen
5 | 100 % | |
4 | 0 % | |
3 | 0 % | |
2 | 0 % | |
1 | 0 % |