
Beschreibung
Break Tracer liest den Trend in zwei Ebenen und handelt nur, wenn sie übereinstimmen.
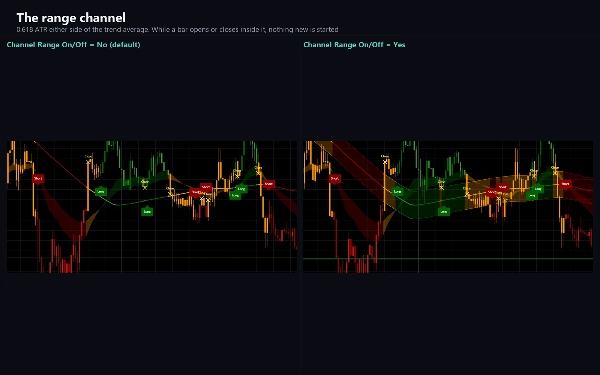
Ein schnelles Paar exponentieller gleitender Durchschnitte (26 und 50) gibt die kurzfristige Richtung vor. Ein 200-Bar-Trend-Durchschnitt mit einem Kanal von 0.618 mal dem durchschnittlichen True Range darum herum gibt den Trend an. Wenn das schnelle Paar nach oben zeigt und der Preis über dem Trend-Durchschnitt liegt, ist der Trend aufwärts; wenn beide nach unten zeigen, ist er abwärts; und solange eine Kerze innerhalb des Kanals öffnet oder schließt, wird der Markt als seitwärts tendierend behandelt und es wird nichts Neues begonnen.
WAS SIE SEHEN
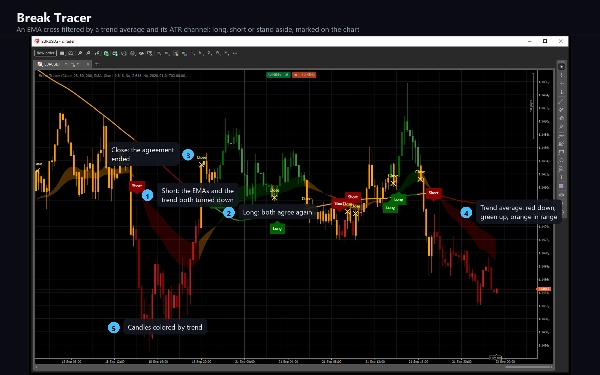
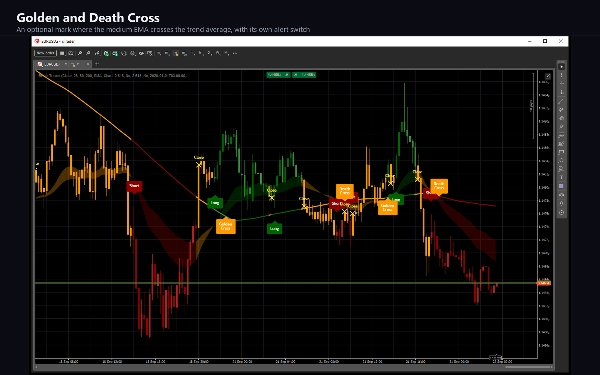
Eine Trendlinie in grünen oder roten Farbtönen, orange während der Markt seitwärts tendiert.
Ein schattiertes Band zwischen den beiden schnellen Durchschnitten, in denselben Farben.
Eine Long-Platte unter der Kerze, wo ein Aufwärtstrend beginnt, und eine Short-Platte über der Kerze, wo ein Abwärtstrend beginnt.
Ein gelbes Kreuz, wo eine Position geschlossen wird, weil sich der Trend oder die schnellen Durchschnitte gedreht haben.
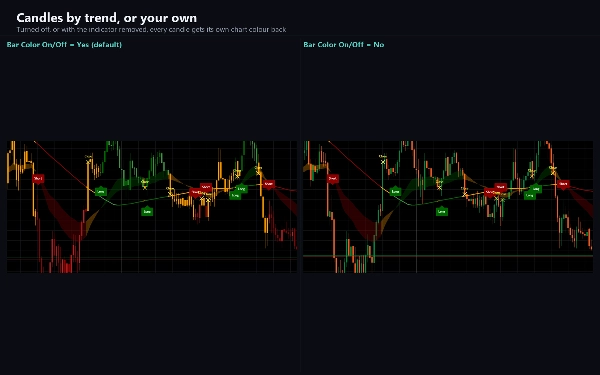
Kerzen, die nach Trend gefärbt sind, mit einem helleren Farbton für eine Kerze, die gegen den Trend schließt.
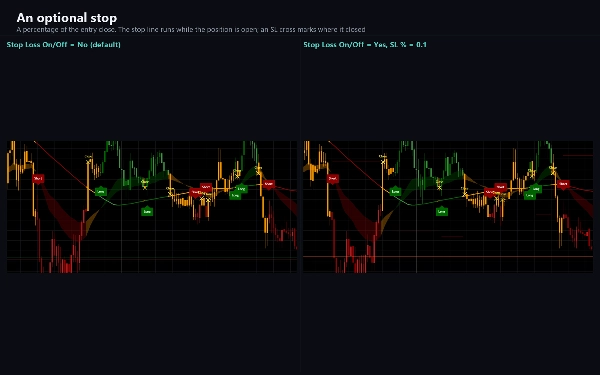
Optional: der Kanal selbst, eine Stopp-Linie mit einem SL-Kreuz auf dem Niveau, das die Position geschlossen hat, Golden Cross- und Death Cross-Platten, wo der mittlere Durchschnitt den Trend-Durchschnitt kreuzt, und eine graue Schattierung außerhalb eines von Ihnen gewählten Datumsfensters.
WIE MAN ES BENUTZT
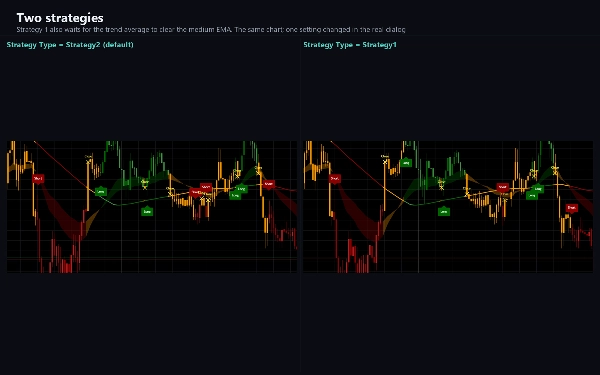
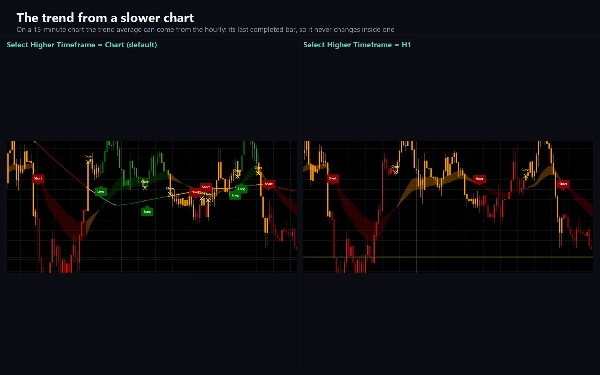
Eine Long- oder Short-Platte markiert den Moment, in dem beide Ebenen übereinstimmen; das Close-Kreuz markiert den Moment, in dem sie aufhören, übereinzustimmen. Strategie 2, die Standardeinstellung, nimmt jede Übereinstimmung; Strategie 1 ist strenger und hält sich zurück, solange der Trend-Durchschnitt noch auf der falschen Seite des mittleren Durchschnitts liegt. Es kann nur Long, nur Short oder beides gewählt werden. Der Trend-Durchschnitt kann aus einem höheren Zeitrahmen genommen werden – zum Beispiel der Stundenchart auf einem Fünf-Minuten-Chart – und verwendet dann die letzte abgeschlossene Kerze des höheren Zeitrahmens, sodass er sich innerhalb dieser Kerze nie ändert.
EINSTELLUNGEN
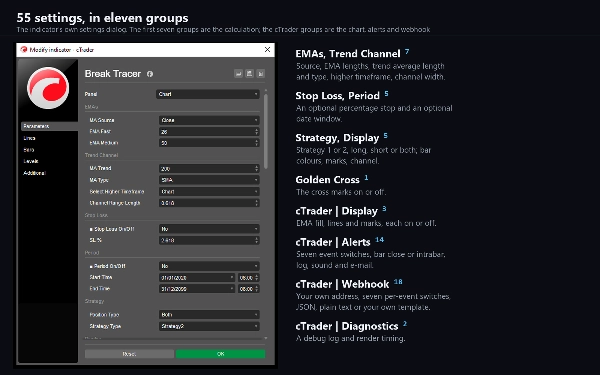
Quelle, EMA-Längen, Trend-Durchschnittslänge und Typ (SMA oder EMA), der höhere Zeitrahmen, die Kanalbreite, ein optionaler prozentualer Stopp, ein optionales Datumsfenster, der Strategietyp und welche Seiten genommen werden sollen. Jedes Zeichenelement hat seinen eigenen Schalter, und das Ausschalten eines Elements ändert nur die Zeichnung: die Werte, Alarme und Webhooks laufen weiter.
ALARME UND WEBHOOK
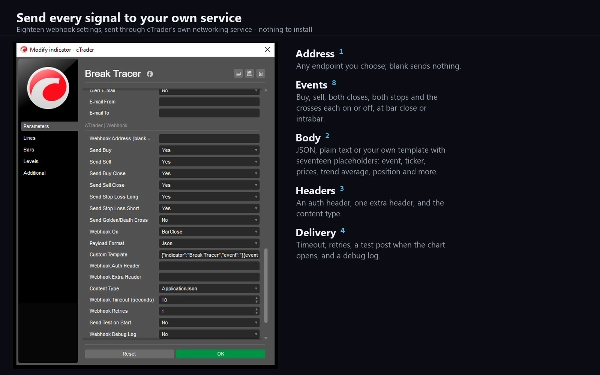
Sechs Ereignisse: Kaufen, Verkaufen, Kauf-Schluss, Verkaufs-Schluss, Stop Loss Long und Stop Loss Short, plus Golden und Death Cross als Option. Jedes hat seinen eigenen Schalter und kann ausgelöst werden, wenn die Kerze schließt oder sobald die Bedingung erfüllt ist. Die Zustellung erfolgt als Protokollzeile, Ton oder E-Mail. Es gibt auch einen Webhook: Geben Sie eine Adresse ein und jedes Ereignis wird als JSON, als Klartext oder in einer von Ihnen selbst geschriebenen Vorlage mit Platzhaltern für Symbol, Zeitrahmen, Zeit, Preise, Durchschnitte, Trendzustand und Position dorthin gesendet. Er bleibt aus, bis Sie einen eingeben, sendet während des historischen Durchlaufs oder in einem Backtest nichts und benötigt keine besonderen Zugriffsrechte – die Posts gehen über den eigenen Netzwerkdienst von cTrader hinaus.
FÜR cBOTS
Der Trend-Durchschnitt, beide schnellen Durchschnitte, der Trendzustand und der Positionszustand werden als Ausgabereihen veröffentlicht.
TYP UND FENSTER
Ein Trendindikator, der im Preischart gezeichnet wird.
ZEITRAHMEN UND INSTRUMENTE
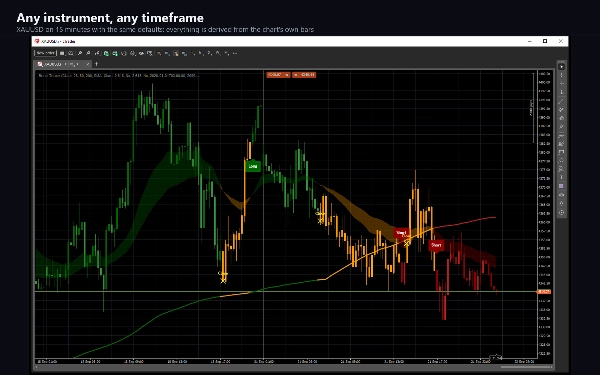
Jeder zeitbasierte Zeitrahmen; die Standardeinstellungen lesen sich gut von M5 bis H4, und die Option für einen höheren Zeitrahmen lässt einen niedrigeren Zeitrahmen einem langsameren Trend folgen. Es funktioniert bei jedem Instrument – Forex-Paare, Metalle, Indizes und Krypto – weil alles, was verwendet wird, aus den Kerzen selbst abgeleitet wird.
FÜR WEN ES GEEIGNET IST
Trader, die einen Trendfilter wollen, den sie sehen können: wann man long gehen soll, wann man short gehen soll, wann man sich zurückhalten soll, und eine Benachrichtigung bei jeder Änderung.
HINWEISE
Die Markierungen folgen der Kerze, die sich noch bildet, sodass eine erscheinen und verschwinden kann, bis diese Kerze schließt. Alarme und Webhook-Posts sind standardmäßig auf Kerzenschluss eingestellt, wo die Bedingung endgültig ist. Auf einem frischen Chart ist die erste Markierung ein Short bei der zweiten Kerze, weil nichts gemessen werden kann, bis die Durchschnitte existieren.
Trading beinhaltet Risiken. Vergangene Leistungen garantieren keine zukünftigen Ergebnisse.
Zusammenfassung
Visual elements include a color-coded trend line (green/red for trend, orange for range), shaded bands between fast EMAs, Long and Short plates marking trend starts, yellow crosses indicating position closes, and candles colored by trend strength. Optional features include the ATR channel display, stop lines with stop-loss crosses, Golden and Death Cross plates, and customizable date window shading.
Break Tracer supports configurable strategies for trade entries and exits, higher timeframe trend averaging, and selective long/short signals. It provides six alert events (Buy, Sell, Close, Stop Loss, Golden/Death Cross) with customizable delivery via log, sound, email, or webhook posting JSON or templated messages. Output series for cBots include trend averages and position states. Settings allow adjustment of sources, lengths, channel width, stop percentages, and visual elements independently.
Kundenbewertungen
5 | 100 % | |
4 | 0 % | |
3 | 0 % | |
2 | 0 % | |
1 | 0 % |