present
Registrieren Sie sich und erhalten Sie $50 Rabatt auf Ihren ersten Kauf
Trading product for Supply Demand Quadra Zones Indikator EMA Key Levels, image 1
Supply Demand Quadra Zones
Indikator
1 käufe
Version 1.0, Sep 2026
Windows, Mac
Trading product for Supply Demand Quadra Zones Indikator EMA Key Levels, image 2
Trading product for Supply Demand Quadra Zones Indikator EMA Key Levels, image 3
Trading product for Supply Demand Quadra Zones Indikator EMA Key Levels, image 4
Trading product for Supply Demand Quadra Zones Indikator EMA Key Levels, image 5
Trading product for Supply Demand Quadra Zones Indikator EMA Key Levels, image 6
Trading product for Supply Demand Quadra Zones Indikator EMA Key Levels, image 7
Trading product for Supply Demand Quadra Zones Indikator EMA Key Levels, image 8
Trading product for Supply Demand Quadra Zones Indikator EMA Key Levels, image 9
Trading product for Supply Demand Quadra Zones Indikator EMA Key Levels, image 10
Trading product for Supply Demand Quadra Zones Indikator EMA Key Levels, image 11
12
Verkäufe
198
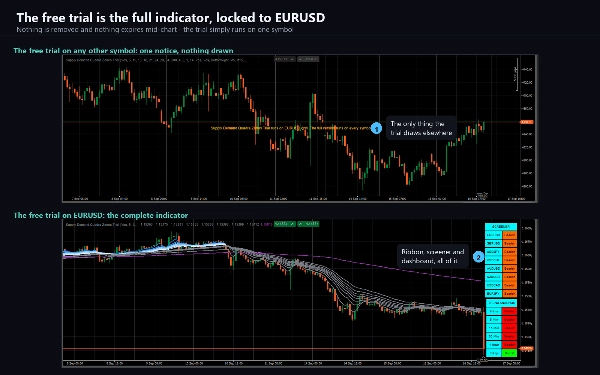
Kostenlose Installationen

Beschreibung

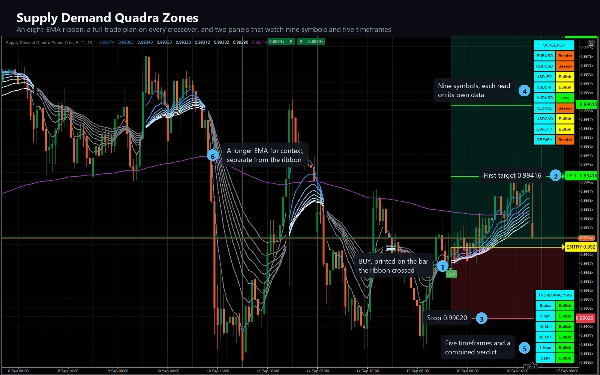
Supply Demand Quadra Zones zeigt ein Einstiegssignal, einen gezeichneten Risikoplan und Ihren weiteren Marktkontext in einem Diagramm.


WAS ES ZEICHNET


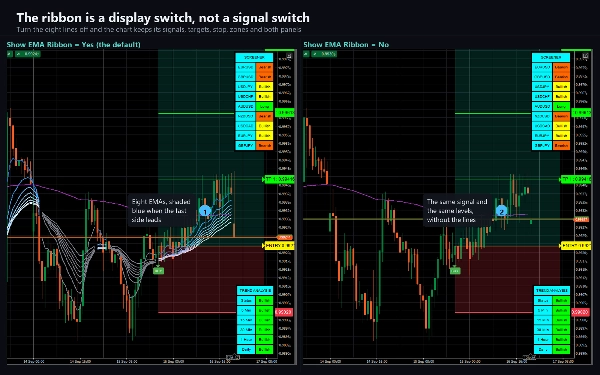
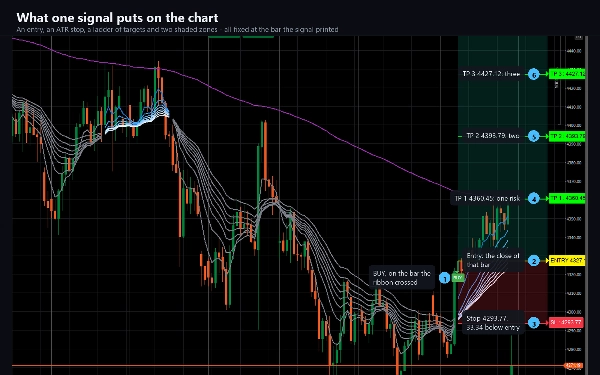
Ein acht-linien EMA-Band (5, 11, 15, 18, 21, 24, 28, 34), das blau wird, wenn das schnelle Bein führt, und grau, wenn nicht, plus eine 200-Perioden-Referenzlinie. Wenn EMA 2 über EMA 8 kreuzt, wird eine KAUF-Platte gezeichnet; wenn es zurückkreuzt, erscheint eine VERKAUF-Platte.


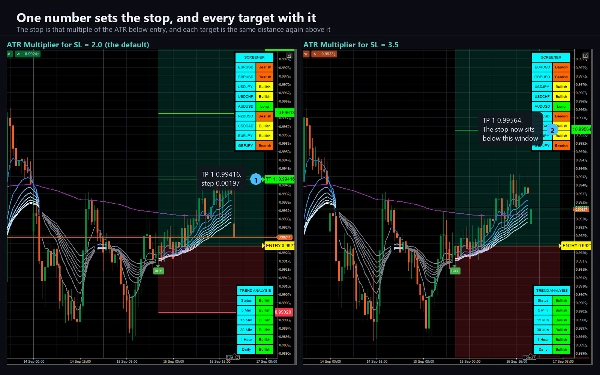
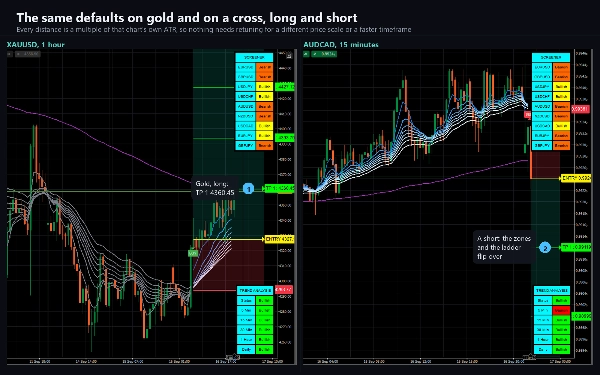
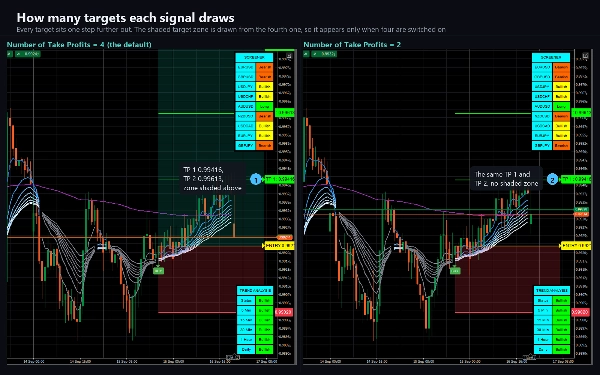
Jedes Signal kommt mit einem vollständigen Risikoplan, der bereits im Diagramm enthalten ist: eine Einstiegslinie, ein Stop, der an einem ATR-Multiplikator platziert ist, und bis zu vier Take-Profit-Stufen, die als Vielfache dieses Stop-Abstands angeordnet sind. Bei den Standardeinstellungen beträgt die Leiter 1R, 2R, 3R und 4R. Jede Stufe trägt ihren eigenen Preisschild am rechten Rand, und der Bereich zwischen Einstieg und Ziel sowie zwischen Einstieg und Stop ist schattiert, sodass die Form des Trades auf einen Blick lesbar ist. Der gesamte Plan verfolgt den Preis nach vorne und friert ein, wenn der Trade aufgelöst wird – entweder wird der Stop berührt oder jedes aktivierte Ziel wurde erreicht.


DIE ZWEI PANELS


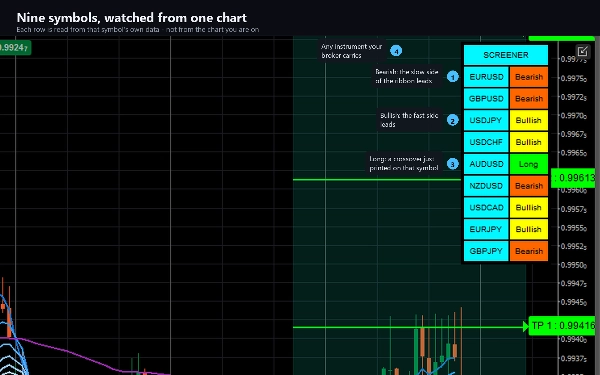
Ein Screener klassifiziert bis zu neun von Ihnen gewählte Symbole – alle im eigenen Zeitrahmen des Charts gelesen – als Long, Short, Bullish oder Bearish, sodass Sie sehen können, welche anderen Märkte sich auf dieselbe Weise ausrichten, ohne neun Charts öffnen zu müssen.


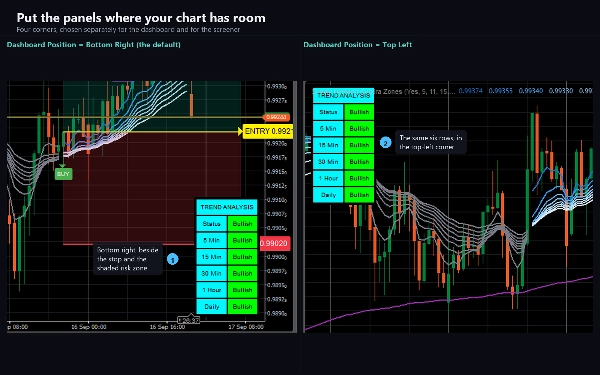
Ein Trend-Dashboard berichtet die Richtung für 5 Minuten, 15 Minuten, 30 Minuten, 1 Stunde und täglich für das Chart-Symbol sowie eine kombinierte Statuszeile, die durch eine Mehrheitsentscheidung von drei von Ihnen ausgewählten Zeitrahmen bestimmt wird.


WEBHOOK


Jedes Signal und jeder Schritt des darauf folgenden Trades kann als JSON an eine von Ihnen gewählte URL gepostet werden – so kann ein externer Bot, ein Journal oder ein Benachrichtigungsdienst darauf reagieren, ohne dass jemand das Chart beobachtet. Es sendet die Seite, den Einstieg, den Stop und die vollständige Ziel-Leiter sowie eine Nachricht für jedes erreichte Ziel, für den Stop und für den Abschluss des Trades. Es ist deaktiviert, bis Sie die URL eingeben, feuert niemals während des Ladens der Historie oder während eines Backtests und benötigt keine erhöhten Berechtigungen.


Alarme werden auch über das cTrader-Protokoll, einen Ton und E-Mail ausgeliefert.


NEUZEICHNUNG, KLAR AUSGEDRÜCKT


Die KAUF- und VERKAUF-Signale werden nicht neu gezeichnet. Sie werden auf geschlossenen Bars entschieden und bewegen sich nach dem Zeichnen nicht mehr.


Die zwei Panels werden neu gezeichnet. Beide werden auf dem Live-Bar gezeichnet und lesen sich entwickelnde Daten höherer Zeitrahmen, sodass sich ihre Zellen ändern können, bis diese Bars schließen. Behandeln Sie sie als ein Live-Bild des aktuellen Stands, nicht als Aufzeichnung dessen, was passiert ist.


EINSTELLUNGEN


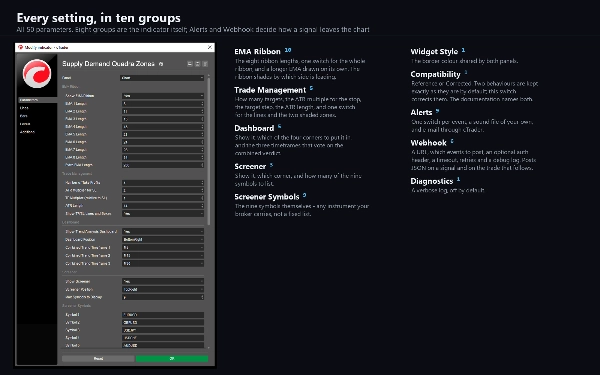
50 Parameter. Alle acht Bandlängen, der ATR-Multiplikator und die Zielabstände, die Anzahl der Ziele, beide Panel-Positionen, alle neun Screener-Symbole, die drei Dashboard-Zeiträume, die Rahmenfarbe, die Alarmkanäle und der Webhook. Eine Kompatibilitätseinstellung wählt zwischen zwei Verhaltensweisen für die 4-Stunden-Dashboard-Option und die schattierte Zielzone – die Dokumentation erklärt genau, was jede bewirkt und warum die Standardeinstellung so ist, wie sie ist.


GEEIGNET FÜR


Jedes Instrument und jeden Zeitrahmen, den die Plattform anbietet. Das Band benötigt 34 Bars, bevor es vollständig gebildet ist, und 200 für die Referenzlinie, sodass sehr kurze Historien weniger Linien zeigen als eine lange.


Trading beinhaltet Risiken. Vergangene Leistungen garantieren keine zukünftigen Ergebnisse.

Zusammenfassung

AI summary
Supply Demand Quadra Zones is a trading indicator designed for use on any instrument and timeframe supported by the platform. It features an eight-line Exponential Moving Average (EMA) ribbon (periods 5, 11, 15, 18, 21, 24, 28, 34) that visually signals trend direction by changing color: blue when the fast leg leads and grey otherwise, alongside a 200-period reference line. Buy and sell signals are generated when the second EMA crosses the eighth EMA, with entry points marked on the chart.

Each trade signal includes a comprehensive risk plan displayed directly on the chart, consisting of an entry line, a stop loss set at a multiple of the Average True Range (ATR), and up to four take-profit levels spaced by multiples of the stop distance. These levels are visually shaded and labeled with price tags for clarity. The risk plan dynamically tracks price movement and freezes upon trade resolution.

The product also includes two panels: a screener monitoring up to nine user-selected symbols on the current timeframe, classifying them as Long, Short, Bullish, or Bearish; and a trend dashboard showing directional trends across five timeframes (5m, 15m, 30m, 1h, daily) with a combined status based on a majority vote of three user-chosen timeframes.

Signals and trade steps can be sent as JSON via webhook to external services for automation or logging. Alerts are available through platform logs, sound, and email. Buy and sell signals are confirmed on closed bars and do not repaint, while the screener and dashboard update live and may change until bar close. The indicator offers extensive customization with 50 parameters covering ribbon settings, ATR multiples, target spacing, panel positions, symbols, alert channels, and webhook configuration.

Indikatorprofil
Indikatorkategorie
Trend
Ausgabetyp
Signale
Datenanforderungen
Nur Balken
Unterstützte Signale
Durchbrechen

Kundenbewertungen

0.0
Bewertungen: 0
Kundenbewertungen
Bisher gibt es keine Bewertungen für dieses Produkt. Haben Sie es schon ausprobiert? Dann können Sie die erste Person sein, die andere darüber informiert!

Diskussion

Häufig gestellte Fragen (FAQ)

EMA
Key Levels
Supply & Demand
ATR
Über den cTrader Store verfügbare Produkte, einschließlich Handelsbots, Indikatoren und Plugins, werden von externen Entwicklern bereitgestellt und nur zu Informations- und technischen Zugriffszwecken verfügbar gemacht. cTrader Store ist kein Broker und erbringt keine Anlageberatung, persönlichen Empfehlungen oder eine Garantie für zukünftige Performance.

Mehr von diesem Autor

Indikator
ATR
CCI
+4
A trend line that never steps back, a shaded band to the price, and a pointer at the swing where the trend turns.
Indikator
ADX
ATR
+5
EMA-cross signals scored on six confluence layers, with an ATR stop, three targets and a live panel
Indikator
ATR
EMA
+3
EMA cross filtered by a trend average and its ATR channel, with long, short and close marks and colored candles.
Indikator
ATR
RSI
+4
Adaptive Ichimoku with nine-factor confluence scoring, five signal types, smart TP/SL and an MTF panel.
Indikator
ATR
RSI
+5
Fusion trend line with a layered cloud, BULL and BEAR labels, scored re-entry triangles and exit markers.
cBot
Balanced
Fixed Lot
+5
Gold grid cBot for XAUUSD H1: four-signal confluence on closed bars, ladders closed at a basket profit, news filter
15.6%
Rendite
2.33
Gewinnfaktor
Indikator
ATR
Volume
+3
Fibonacci trend signals on closed bars, with an ATR stop, up to four targets and a break-even ladder.
Indikator
ATR
RSI
+4
RSI bands drawn on price, confluence-scored BUY/SELL signals, an ATR stop with three targets
cBot
TP Manager
Break Even
+5
Gold cBot for prop-firm accounts: pick your firm, phase and size; risk is sized from the firm's rules, its limits kept
1.6
Gewinnfaktor
Indikator
ADX
ATR
+5
Ten confluence layers scored on every closed bar, with an anti-chop gate, pivot levels and a live dashboard.
Indikator
ADX
ATR
+5
SuperTrend signals scored on five confluence factors, with an ATR stop, three targets and a dashboard.
cBot
Channel
Fixed Lot
+5
Gold breakout cBot for XAUUSD M1: H4 high/low channel, RSI veto, one recovery step and a max drawdown close-all
20%
Rendite
4.42
Gewinnfaktor

Das könnte Sie auch noch interessieren

Indikator
AI
Forex
+5
Dynamic, color‑coded candles reveal market shifts instantly—spot momentum and trend reversals at a glance
Indikator
ADX
ATR
+5
EMA-cross signals scored on six confluence layers, with an ATR stop, three targets and a live panel
Indikator
AI
ATR
+20
Algorithmic trend precision for cTrader.
Indikator
VWAP
Volume
+3
Don't trust static support and resistance levels, this indicator combines Fibonacci and VWAP in one powerful tool.
Indikator
ATR
EMA
+3
EMA trend, RSI reclaim and divergence signals with ATR stop and two targets, swing levels and a 16-row dashboard.
Indikator
SMC
Prop
+9
PDL/PDH/PWL/PWH and Session higs/lows (customizable)
Indikator
EMA
SMA
+3
MACD indicator modeled after TradingView, featuring a 4-color momentum histogram, sound/pop-up crossover alerts.
Indikator
EMA
Volume
+4
Advanced volume‑profile tool with delta, HVN/LVN zones, and precise POC‑based trade signals.
Indikator
AI
Signal
+1
🔥 THIS BURNS JP225 INDICATOR – Professional Trading Signals
Indikator
ATR
RSI
+5
Multi-factor VWAP mean-reversion signals with ATR bands, volume exhaustion, and RSI gate on cTrader.
Indikator
ATR
SMC
+18
Super Wick detects powerful candle rejections: fractal long-wicks, HTF resonance zones, and a WSI gauge.
Indikator
SMC
Prop
+17
Unlock the true intent of market participants with the Classic Proportional Cumulative Volume Delta CVD!
„Dem“-Logo
Beste Ratings
4.2
(4)
$20
Indikator
Forex
BTCUSD
+5
Scalping indicator for Renko 100 using EMAs to show trend and entry zones with clear colored rectangles.
Indikator
VWAP
Volume
+3
Track hidden trading activities to be on the right side of the market.
Indikator
ATR
Forex
+5
Most used candle patterns. (1 candle, 2 candles and 3 candles patterns) and Marubozu. Bonus Fibo Risk control.
Indikator
Three ZigZag lines
Indikator
SMC
Prop
+4
📈 Trading Sessions Indicator — London, New York & Tokyo Visualize Key Market Sessions + High/Low Levels with Precision
Indikator
AI
ATR
+20
Buy and Sell Signals

Preis

12
Verkäufe
198
Kostenlose Installationen