

Opis
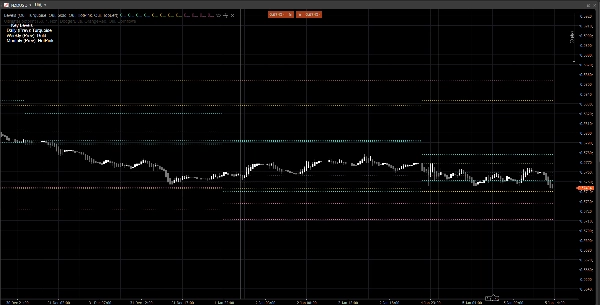
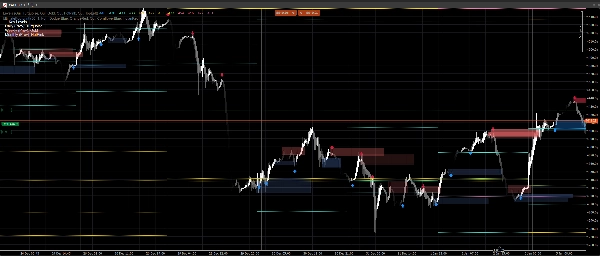
Strefy Price Action to lekki, wolny od szumów wskaźnik, który rysuje poprzednie kluczowe poziomy Dziennych, Tygodniowych i Miesięcznych bezpośrednio na twoim wykresie.
Wyświetla:
- Poprzedni Dzień: Maksimum / Minimum / Otwarcie / Zamknięcie
- Poprzedni Tydzień: Maksimum / Minimum / Otwarcie / Zamknięcie
- Poprzedni Miesiąc: Maksimum / Minimum / Otwarcie / Zamknięcie
Te poziomy są szeroko stosowane jako strefy reakcji, referencje płynności oraz kotwice kontekstowe dla struktury rynku, wejść, celów i rozmieszczenia ryzyka.
Dlaczego jest to przydatne
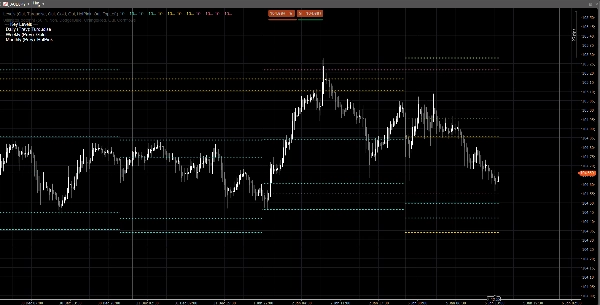
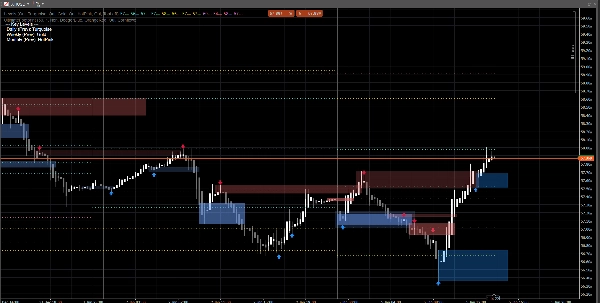
- Natychmiast zobacz poziomy odniesienia z wyższych interwałów bez przełączania wykresów
- Pomaga ramować intradayową akcję cenową wokół PDH/PDL, PWH/PWL, PMH/PML
- Czysty wizualnie: poziomy pozostają stałe dla bieżącej sesji/tygodnia/miesiąca
- Działa na dowolnym symbolu i interwale czasowym
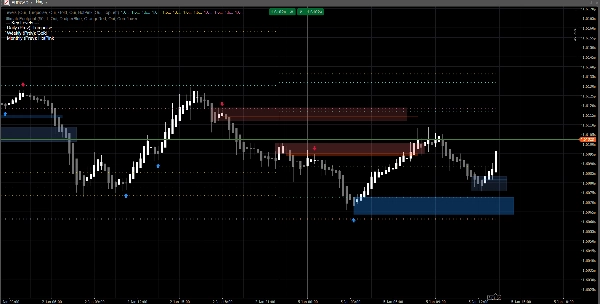
Personalizacja
Możesz niezależnie włączać każdy interwał czasowy:
- Pokaż Dzienny / Tygodniowy / Miesięczny
- Ustaw niestandardowy kolor dla każdej grupy
- Włącz prostą legendę, z możliwością wyboru położenia w rogu
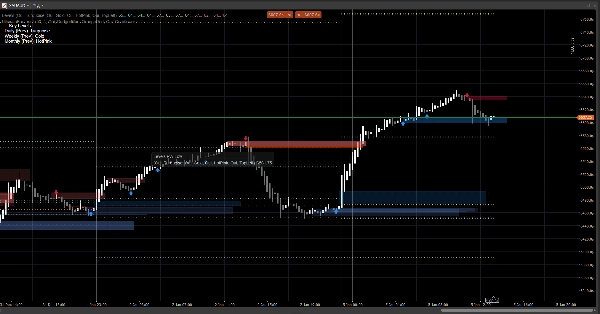
Uwagi techniczne
- Poziomy są obliczane na podstawie poprzedniej zakończonej świecy Dziennych/Tygodniowych/Miesięcznych (nie bieżącej formującej się).
- Zapobiega to przerysowywaniu i utrzymuje poziomy stabilne podczas sesji.
Zastrzeżenie
Ten wskaźnik jest dostarczany wyłącznie do celów wykresowych i wsparcia decyzji. Nie generuje sygnałów kupna/sprzedaży i nie stanowi porady finansowej. Zawsze zarządzaj ryzykiem i weryfikuj na własnych danych.
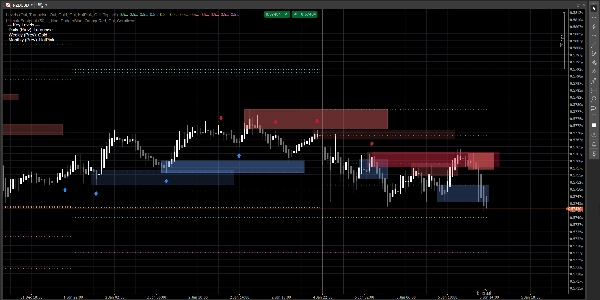
Sygnały na wykresie są generowane przez wskaźnik Ultimate Footprint dostępny na moim profilu.


