
Descrição
Indicadores da loja Pinescriptlabs: 🤖Pinescriptlabs Loja cBots : (cBot)
PRICE ACTION (Novo)
Gold & BTC BreakoutSession Pivots(novo)
Trailing Smart Algorithm(Novo)
SmartTrend Support &
Resistance
Lines
Dynamic
Market Structure
Analysis
of
Turning Points
Fibonacci
Linear
Regression
Multi-timeframe
Multi-Level
Candle Bias
Tracker
Auto
Support and
Resistance
Trend
Lines
All
Support and
Resistance
Levels
Zig Zag Support & Resistance with Swings
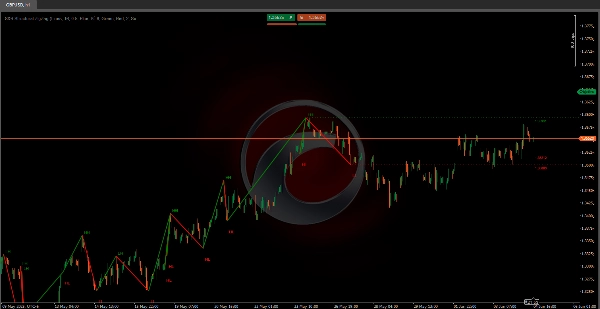
1. O que este indicador faz? ❓
🔍 Detecta oscilações de preço (máximos e mínimos)
- Escaneia barras recentes ("Profundidade da Análise") para encontrar o preço mais alto/mais baixo nessa faixa.
- Valida as oscilações com um limiar % (ex.: mudança de 1%+ em relação à última oscilação) → Marca novos ✅ Máximos/Mínimos de Oscilação.
- Reduz o ruído ⚡: Confirma oscilações somente se metade do período de análise passar sem um máximo mais alto/mínimo mais baixo.
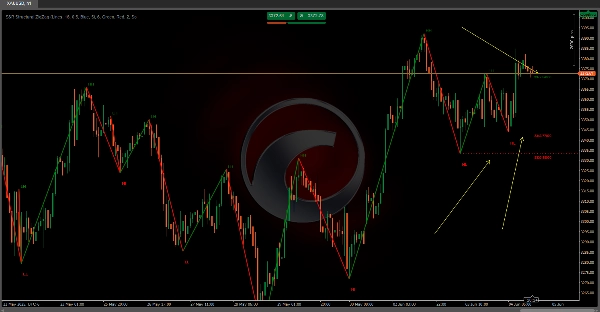
📉 Desenha linhas de tendência Zigzag
- Conecta oscilações com linhas dinâmicas:
-
- 🟢 Verde = Tendência de alta (nova oscilação > anterior).
- 🔴 Vermelho = Tendência de baixa (nova oscilação < anterior).
⏹️ Destaca níveis chave
- Linhas de Suporte/Resistência: Desenhadas no preço exato de cada oscilação, estendidas para a direita
- Etiquetas mostram valores de preço 📌 (ex.: "1.1050") para análise instantânea.
🚦 Revela a estrutura do mercado
- Identifica tendências de relance:
-
- Bullish = Máximos mais altos (HH) + Mínimos mais altos (HL).
- Bearish = Máximos mais baixos (LH) + Mínimos mais baixos (LL).
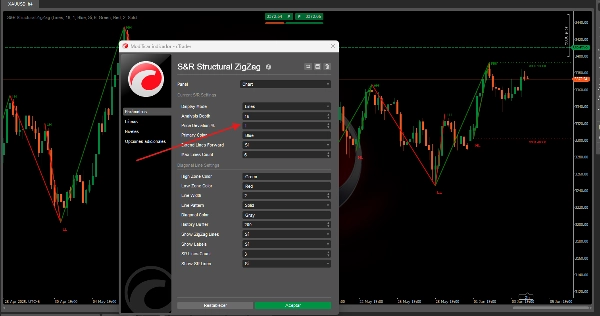
2. Como usar (Guia de configuração) ⚙️
Instale no cTrader: Arraste e solte no seu gráfico!
Configurações principais:
- Profundidade da Análise 🔎:
10(padrão) → Valores maiores filtram ruído; valores menores capturam mais oscilações. - Desvio de Preço % 📏:
1.0%(ajustável) → Mudança mínima de preço para validar oscilações. - Etiquetas de Oscilação 🏷️ (HH/HL/LH/LL): Ativar/Desativar.
- Estender Linhas ➡️: Projeta níveis de S/R infinitamente ou limita às barras atuais.
Resumo
Avaliações de clientes
5 | 100 % | |
4 | 0 % | |
3 | 0 % | |
2 | 0 % | |
1 | 0 % |


