
Order Flow Ticks v2.0
Indicatore
12.05K download
Versione 1.1, Jan 2026
Windows, Mac
4.4
Recensioni: 23
Descrizione
Ultima descrizione -> 11/11/2025
Ogni aspetto di Order Flow Ticks (versione aggregata) è stato progettato con cura pensando alle prestazioni in modo da poter funzionare anche su macchine di fascia bassa.
Ecco comunque alcuni "Consigli e Trucchi" per un uso migliore:
- I dati Tick sono memorizzati nella RAM, anche se cTrader ha già una buona gestione della memoria:
-
- Carica solo ciò che è realmente necessario per il trading in tempo reale.
- Il pannello Parametri mostra già quali parametri sono supportati da ogni modalità.
- L'intervallo dei segmenti può modificare l'analisi dei filtri, usa l'intervallo Giornaliero per il momentum intraday.
- Ai Timeframe più alti (inclusi i grafici basati sul prezzo)
-
- Imposta ODF + VP su Settimanale
- Parametri Nº giorni / Reset Giornaliero? ora sono Settimana/Settimanale.
- Tutti i filtri verranno resettati ogni settimana invece che ogni giorno.
- "Timeframe inferiore" con "Piccola dimensione riga":
-
- MA personalizzate sono create per velocizzare il ricalcolo quando si cambiano le impostazioni nel Pannello Parametri.
- Se vuoi mantenere le Medie Mobili di cTrader, imposta [ODF] Usa MA personalizzate? su Falso
-
- Abbi pazienza se qualche filtro [Risultati / Spike / Bolle] è attivato.
- Se è necessaria un' alta prestazione:
-
- Disabilita il profilo volume e/o usa Mini-VP invece. (predefinito)
- Usa "Concurrent" su "[VP] Strategia di aggiornamento" in "Impostazioni specifiche", però c'è un costo in termini di uso RAM. (predefinito)
- Usa "Redraw_Fastest" nelle impostazioni "Disegno prestazioni" (predefinito)
- Usa MA personalizzate (predefinito)
- Qualsiasi disegno riempito e/o testo è piuttosto pesante quando ce ne sono molti.
- Durante il back-testing, alcuni disegni sui grafici basati sul prezzo sono rotti, ma funzionano bene in tempo reale.
- Le impostazioni salvate sono memorizzate in "Documents/cAlgo/LocalStorage/ODFT-AGG ..."
Nuove funzionalità di analisi di Order Flow Ticks:
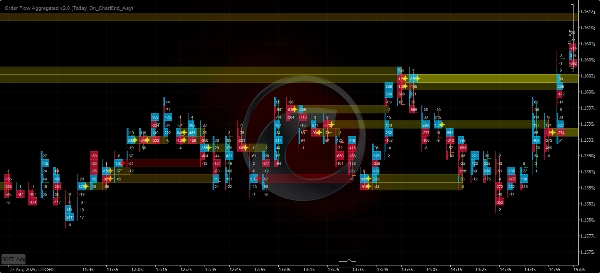
- Filtro Spike Tick
-
- Media mobile o deviazione standard.
- come icona o bolle.
- Livelli Spike.
- Grafico Spike (bolle):
-
- Colorazione Heatmap.
- Colorazione positiva/negativa.
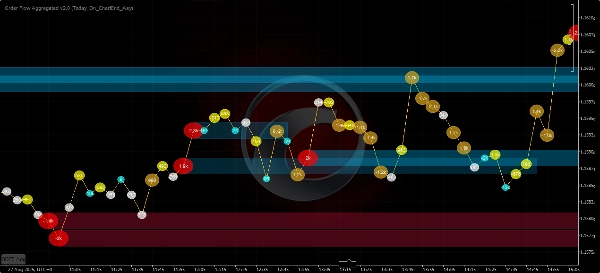
- Grafico a bolle
-
- Medie mobili, deviazione standard o entrambe.
- [Delta volume / Delta cumulativo / Sottrai delta] come fonte.
- Livelli Ultra Bubbles.
- Colorazione Heatmap.
- Colorazione momentum:
-
- Svanimento
- Positivo/Negativo
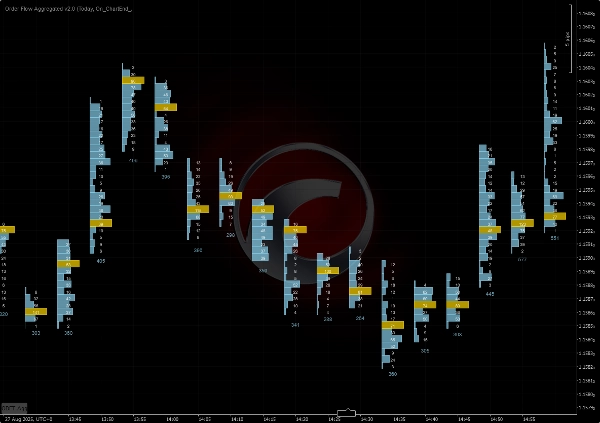
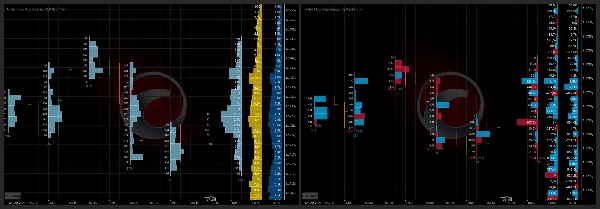
- Profilo volume
-
- Mini-VP - Da 5 minuti a 1 giorno.
- Profili giornalieri, settimanali, mensili!
- Profili a intervallo fisso.
=============================
Preferisci sempre la versione dello Store di cTrader, è aggiornata per prima.
Tutti gli indicatori che ho sviluppato sono open source. Se non hai accesso al codice, dai un'occhiata al repository Github
Riepilogo
Riepilogo AI
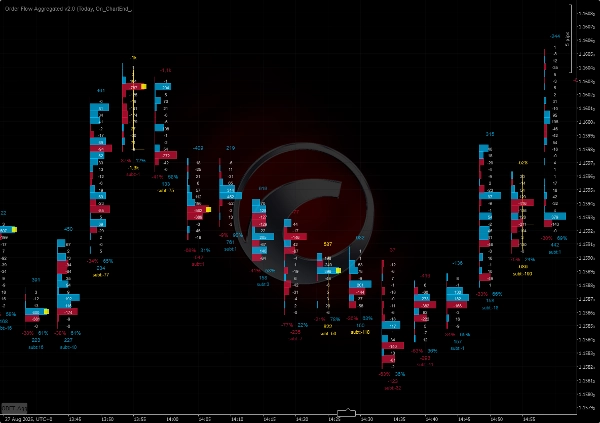
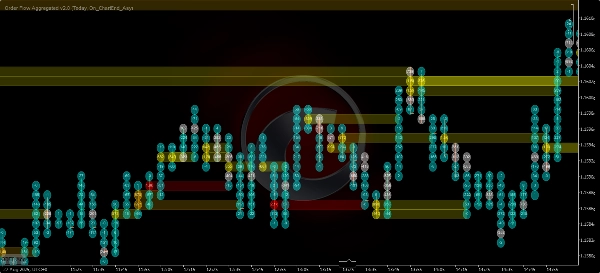
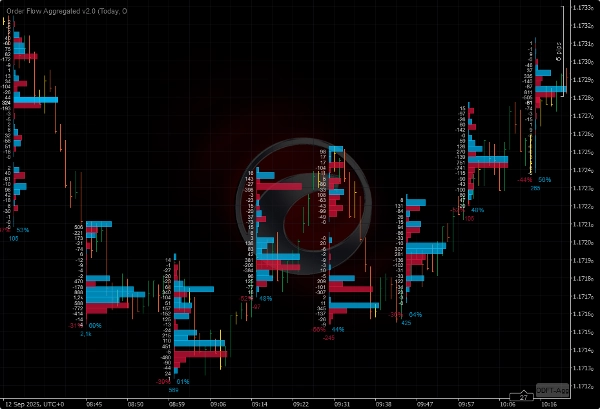
Order Flow Ticks v2.0 is an open-source indicator for the cTrader platform that adapts traditional Order Flow (Footprint) concepts to tick volume data. It supports multiple chart types including ticks, Renko, and range charts. The indicator offers several visualization modes: Normal Mode (volume profile per bar), Buy vs Sell Divided Mode (bid/ask footprint), Buy vs Sell Profile Mode, Delta Divided Mode (delta footprint), and Delta Profile Mode.
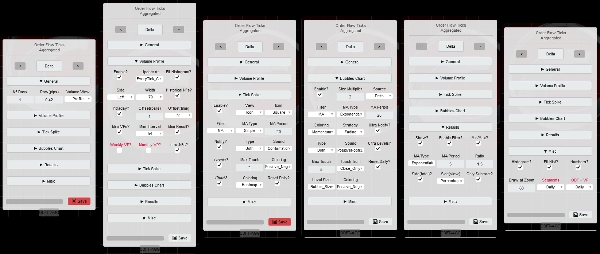
Version 2.0 introduces a parameters panel for quick switching between settings such as volume modes and row height, and it uses the Colors API exclusively. It is compatible with Mac OS and requires .NET 6.0 or higher.
Key features include:
- Tick Spike Filter with moving average or standard deviation, displayed as icons or bubbles with heatmap and positive/negative coloring.
- Bubbles Chart showing volume delta, cumulative delta change, or subtract delta with momentum coloring and ultra bubble levels.
- Volume Profile options including mini-profiles from 5 minutes to 1 day, daily, weekly, monthly, and fixed range profiles.
The indicator is optimized for performance to run efficiently on lower-end machines. It stores tick data in RAM and offers settings to balance performance and detail, including custom moving averages and concurrent update strategies. Saved settings are stored locally.
Profilo indicatore
Recensioni dei clienti
4.4
Recensioni: 23
5 | 74 % | |
4 | 13 % | |
3 | 4 % | |
2 | 0 % | |
1 | 9 % |
Recensioni dei clienti
May 13, 2026
Just a note to say thank you to the creator for making this free of charge. Appreciate it.
March 23, 2026
It's great, Thank you! Can you pls make an update, it doesnt work fully on Indices on CFD
March 9, 2026
"Thank you very much for your work on Order Flow Tick 2.0. It is truly excellent and unique."
October 22, 2025
this is great, i just can't see all the options because the panel is cut short. i don't have access to the bubbles and other features that are apparently there in the code
September 27, 2025
August 3, 2025
Amazing indicator! Once you learn how to use it it really helps out so much, love it!
July 9, 2025
Pros: Real-time tick flow visualization with buy/sell separation. Helps assess market activity and hidden liquidity. Easy to set up, works stable on major assets. Cons: No alerts on tick spikes. No history or tooltips. Requires experience to interpret data correctly.
July 3, 2025
June 20, 2025
Great indicator. It takes a bit of work to learn how to use it properly. Not to be used in isolation, you need to plan potential reversal zones.
April 15, 2025
This looks promising! I tested it out manually, but I would love to automate it! How could we get the source code? :) Really, Pls.
Discussioni
Domande frequenti
VWAP
I prodotti disponibili tramite cTrader Store, inclusi bot di trading, indicatori e plugin, sono forniti da sviluppatori terzi e resi disponibili esclusivamente a scopo informativo e di accesso tecnico. cTrader Store non è un broker e non fornisce consulenze in materia di investimento, raccomandazioni individualizzate o garanzie di risultati futuri.


Prezzo
Da 12/12/2024
1
Vendite
33.12K
Installazioni gratuite