
TPO Profile v2.0
Indicatore
4.16K download
Versione 1.1, Jan 2026
Windows, Mac
4.8
Recensioni: 7
Descrizione
Ultima descrizione -> 11/11/2025
Novità nella Revisione 1?
- Riscritto utilizzando miglioramenti correlati di Order Flow Aggregated/Volume Profile.
- Aggiornamento Live TPO concorrente
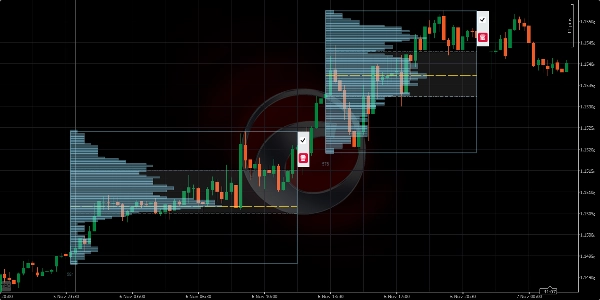
- Mostra uno o tutti (Mini-VPs/Giornalieri/Settimanali/Mensili) Profili contemporaneamente!
- Profili a intervallo fisso
- Correzione => Pannello parametri su MacOS
================================
Preferisci sempre la versione dello Store di cTrader, è aggiornata per prima.
Tutti gli indicatori che ho sviluppato sono open source. Se non hai accesso al codice, dai un'occhiata al repository Github
Riepilogo
Riepilogo AI
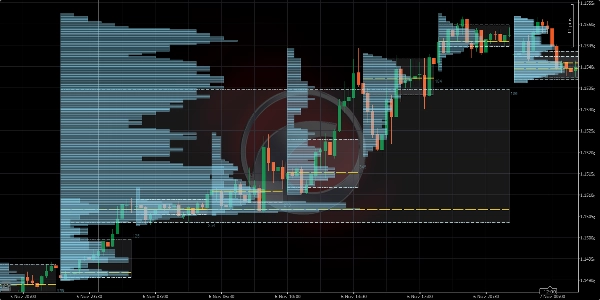
TPO Profile v2.0 is an open-source trading indicator designed for use on the cTrader platform. It provides Time Price Opportunity (TPO) profiles that display market activity divided into columns, similar to traditional market profile charts. The indicator supports multiple preset settings optimized for various asset classes including currencies, metals, and indices, with timeframes ranging from 1 minute up to 3 days.
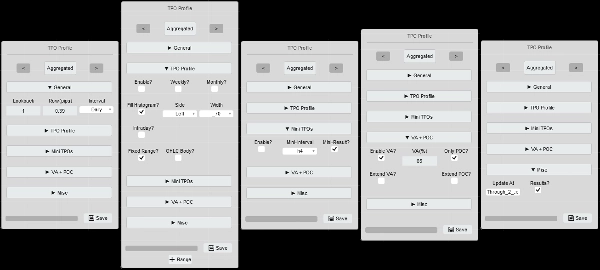
Key features include a parameters panel for quick switching between TPO modes, row height, and interval settings, enhancing user customization and ease of use. The indicator offers concurrent live TPO updates and the ability to display multiple profile types simultaneously, such as Mini Volume Profiles, Daily, Weekly, and Monthly profiles. Fixed range profiles are also supported.
TPO Profile v2.0 is designed for low resource usage, capable of running efficiently even on low-powered hardware. It requires .NET 6.0 or higher and is compatible with Mac OS. Users can synchronize the indicator’s session display with cTrader’s timezone settings for accurate period separation.
The indicator is part of a suite of volume and order flow tools available for cTrader and is maintained with ongoing updates and improvements. The source code is accessible via a public GitHub repository.
Profilo indicatore
Recensioni dei clienti
4.8
Recensioni: 7
5 | 86 % | |
4 | 14 % | |
3 | 0 % | |
2 | 0 % | |
1 | 0 % |
Recensioni dei clienti
April 17, 2026
December 19, 2025
November 13, 2025
September 21, 2025
July 9, 2025
Pros: Accurate TPO profile visualization, flexible period and color settings, clear POC/VAH/VAL levels. Cons: No historical profile archive, lacks alerts on key levels, slight lag on lower timeframes with dense data.
June 23, 2025
June 17, 2025
Discussioni
Domande frequenti
Forex
Indices
VWAP
I prodotti disponibili tramite cTrader Store, inclusi bot di trading, indicatori e plugin, sono forniti da sviluppatori terzi e resi disponibili esclusivamente a scopo informativo e di accesso tecnico. cTrader Store non è un broker e non fornisce consulenze in materia di investimento, raccomandazioni individualizzate o garanzie di risultati futuri.


Prezzo
Da 12/12/2024
1
Vendite
33.16K
Installazioni gratuite