
Opis
System Weis & Wyckoff teraz obsługuje dowolny wykres! [Świece, Tick, Renko, Zakres, Heikin-Ash]
Ostatni opis -> 11/11/2025
System Weis & Wyckoff prezentuje koncepcje Davida H. Weisa i Richarda Wyckoffa
Co nowego w rewizji 1?
- Wsparcie dla wykresów [Świece, Heikin-Ash, Tick, Zakres]
- Ulepszona obsługa ZigZag => MTF + tryby [ATR, Procent, Pipsy, NoLag_HighLow]
- Zawiera wszystkie ulepszenia związane z "Order Flow Aggregated"
-
- Niestandardowe MA
- Rysowanie wydajności
- Filtry siły (MA/StdDev/Oba)
- Wysokowydajna funkcja VP_Tick()
- Wysokowydajna funkcja GetWicks()
- Asynchroniczne zbieranie danych Tick
- Poprawka => Panel parametrów na MacOS
==========================
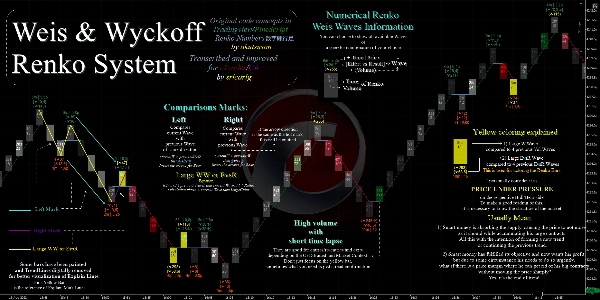
To tylko sposób numerycznego wizualizowania fal i wolumenu, to nie jest oryginalny pomysł.
Pierwsze zastosowanie tej metody wizualizacji można znaleźć tutaj:
- David Weis o Wyckoffie | Wsparcie/Opor | i fale,
- Weis o wykresach Renko Wyckoffa - Linda Raschke (najnowsze)
Wykorzystuje to koncepcje kodu:
- (Numbers-Renko 数字練行足 w PineScript),
- Podziękowania dla akutsusho!.
Ja ulepszyłem to i przeniosłem do cTrader/C# i jest to również darmowe/otwarte oprogramowanie.
=========================================
Transkrypcja i ulepszenie dla cTrader/C#
przez srlcarlg
Oryginalne koncepcje kodu w TradingView/Pinescript
przez akutsusho
=========================================
Zawsze preferuj wersję ze sklepu cTrader, jest aktualizowana jako pierwsza.
Wszystkie wskaźniki które opracowałem są open source. Jeśli nie masz dostępu do kodu, sprawdź repozytorium Github
Podsumowanie
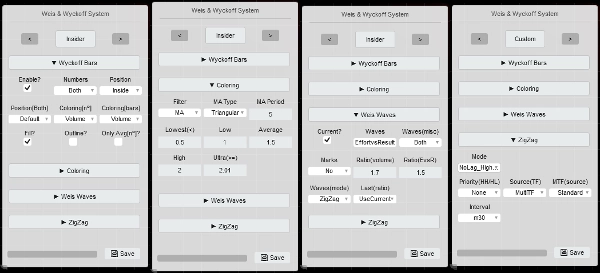
Key features include:
- A versatile Params Panel with four layout templates (Insider, Time, Volume, BigBrain) for quick and user-friendly customization.
- Enhanced ZigZag functionality with multi-timeframe support and multiple modes such as ATR, Percentage, Pips, and NoLag High/Low.
- Integration of order flow aggregation improvements, including custom moving averages, performance drawing, strength filters (MA, StdDev, or both), and high-performance tick volume and wick calculations.
- Dynamic TimeLapse feature showing time waves across various intervals from milliseconds to days.
- Compatibility with Mac OS and requires .NET 6.0 or higher.
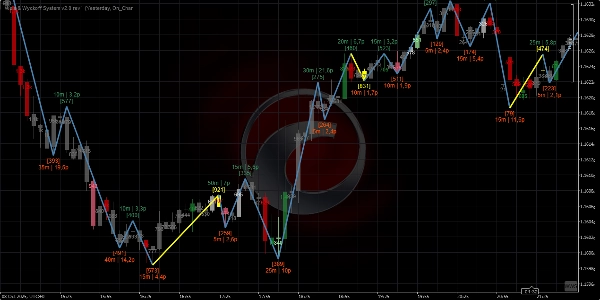
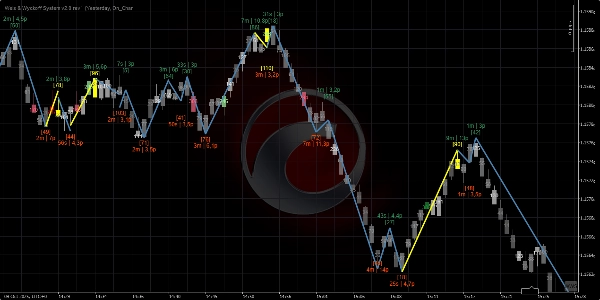
The indicator is a C# adaptation and improvement of original PineScript concepts, designed to provide detailed wave and volume visualization without repainting options. It is maintained as open source, with code available on GitHub for transparency and further development.
Opinie klientów
5 | 100 % | |
4 | 0 % | |
3 | 0 % | |
2 | 0 % | |
1 | 0 % |


![Logo „Smart Money Concepts (SMC) [Iridio Capital]”](https://cdn.ctrader.com/image/webp/28b69fd1-ef54-4bed-9487-07e78e883be4_40934)


