
Free Volume Profile v2.0
Indicatore
9.64K download
Versione 1.1, Jan 2026
Windows, Mac
4.7
Recensioni: 9
Descrizione
Ultima descrizione -> 11/11/2025
Novità nella Revisione 1?
- Riscritto utilizzando miglioramenti correlati di Order Flow Aggregated/Volume Profile.
- VP_Bars ad alte prestazioni
- Aggiornamento VP Live concorrente
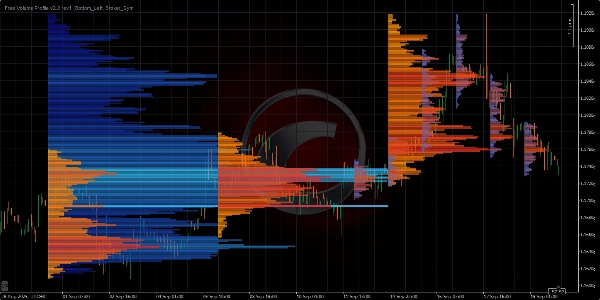
- Mostra uno o tutti (Mini-VPs/Giornalieri/Settimanali/Mensili) profili contemporaneamente!
- Profili a intervallo fisso
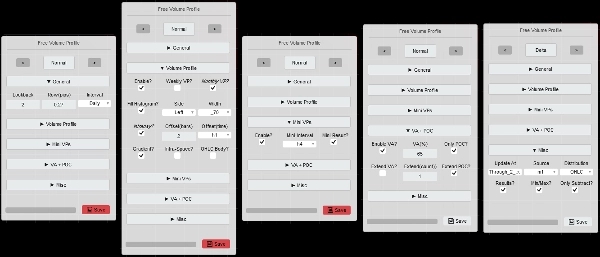
- Correzione => Pannello parametri su MacOS
=============================
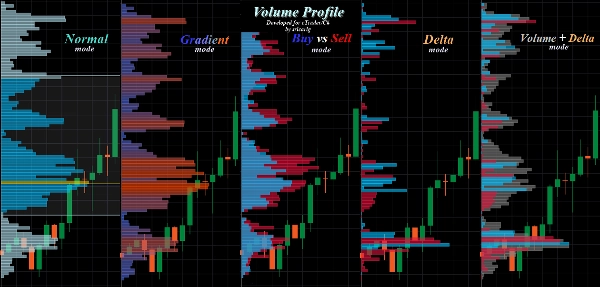
Modalità Normale = Profilo di volume con colore fisso/gradiente
Modalità Acquisto vs Vendita = Il nome parla da sé
Modalità Delta = Profilo Delta di volume
Il calcolo del volume(Fonte volume barre)
è esportato, con adattamenti, dal MIGLIORE VP che abbia visto/usato,
di FXcoder, autore del famoso (Volume Profile + Range v6.0)
un GRANDE GRAZIE a LUI!
==============================
Preferisci sempre la versione dello Store di cTrader, è aggiornata per prima.
Tutti gli indicatori che ho sviluppato sono open source. Se non hai accesso al codice, dai un'occhiata al repository Github
Riepilogo
Riepilogo AI
Free Volume Profile v2.0 is an open-source trading indicator designed for volume-based market analysis. It builds on the core features of the TPO Profile v2.0 but focuses on volume data, integrating functionalities from Order Flow Ticks v2.0. The indicator supports multiple display modes including Normal (volume profile with fixed or gradient colors), Buy vs Sell, Delta (volume delta profile), and a combined Normal+Delta mode.
Key features include a parameters panel for quick switching between settings such as volume modes, row height, and intervals, enhancing user-friendliness. It offers high-performance volume profile calculations adapted from FXcoder’s Volume Profile + Range v6.0, with concurrent live updates and the ability to display multiple profiles simultaneously (mini, daily, weekly, monthly). Fixed range profiles are also supported.
The indicator is compatible with Mac OS and requires .NET 6.0 or higher. It is suitable for traders seeking detailed volume distribution insights across various timeframes and supports advanced volume analysis through its integration of order flow and delta volume data. The source code is available on GitHub for transparency and customization.
Profilo indicatore
Recensioni dei clienti
4.7
Recensioni: 9
5 | 78 % | |
4 | 22 % | |
3 | 0 % | |
2 | 0 % | |
1 | 0 % |
Recensioni dei clienti
April 17, 2026
February 3, 2026
November 4, 2025
Thank you for your excellent work, and for making it free, you are a good person
October 21, 2025
Great indicator but it lags on adding VAs and Moving from Gradient to either BuySell or Delta how to fix this
August 26, 2025
Great tool. It is a little buggy but great feature. Also hoped cTrader would make this native.
July 9, 2025
Pros: Clear manual volume profile for selected range. Shows accumulation zones and POC levels. Stable, customizable, easy to use. Cons: No automatic profile building by time. No history of profiles. Lacks alerts on price touching key levels.
June 21, 2025
Discussioni
Domande frequenti
VWAP
I prodotti disponibili tramite cTrader Store, inclusi bot di trading, indicatori e plugin, sono forniti da sviluppatori terzi e resi disponibili esclusivamente a scopo informativo e di accesso tecnico. cTrader Store non è un broker e non fornisce consulenze in materia di investimento, raccomandazioni individualizzate o garanzie di risultati futuri.


![Logo di "Smart Money Concepts (SMC) [Iridio Capital]"](https://cdn.ctrader.com/image/webp/28b69fd1-ef54-4bed-9487-07e78e883be4_40934)


Prezzo
Da 12/12/2024
1
Vendite
33.21K
Installazioni gratuite