Opis
🏆 10 000+ traderów ufa naszemu zestawowi 25+ algorytmów! 🏆
Od Struktury Rynku i Płynności do Inteligentnych Systemów Wyjścia i Narzędzi Predykcyjnych - stworzyliśmy KAŻDE narzędzie, którego potrzebujesz do konsekwentnych wyników.
👉 Uzyskaj dostęp do wszystkich 25+ SPRAWDZONYCH systemów:
_______________________________________________
📌 Wskaźniki Struktury Rynku
· ✅ AdvancedMarket Structure: Bos, Choch, SwinLevels, Order Blocks, Market Structure& Liquidity Finder
· 🔄Dynamic Market StructureAnalysis of Turning Points
· 🧱 Order Block
· ⚖️ Market Imbalance
· ⛓️ BOS & CHOCH
· 🧠 ICT Power of 3
_______________________________________________
🔚 Inteligentne Systemy Wyjścia
_______________________________________________
📐 Wskaźniki ZigZag
· 🔍 ZigZag Price LiquidityProjection
· ➖ ZigZag
_______________________________________________
🧱 Wskaźniki wsparcia i oporu
· 🟩 SmartTrend Support &Resistance Lines
· 🧱 All Support and ResistanceLevels
_______________________________________________
📊 Wskaźniki trendu i kanału
· 📊 Supertrend
_______________________________________________
💧 Narzędzia Wolumenu i Płynności
_______________________________________________
⚡ Wskaźniki Momentum i RSI
· 🔎 Multi-Level Candle Bias
Tracker
_______________________________________________
🔮 Narzędzia Predykcji i Projekcji
· 📐 Predykcja oparta na Linreg& ATR
· 📏 Fibonacci Linear RegressionMulti-timeframe
· 📈 Projektor przepływu rynku napędzany wolumenem_________________________
_________________________________________________________________________________________________
_________________________________________________________________________________________________
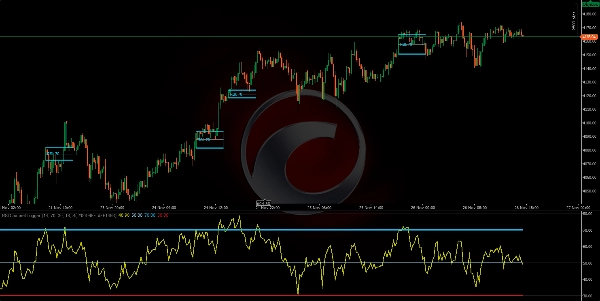
WYZWALACZ KANAŁU RSI: 📶
Co to jest: Wskaźnik, który oblicza RSI (okres) i wizualnie oznacza strefy momentum, gdy RSI przekracza progi wykupienia/wyprzedania (domyślnie 70/30). ✅
https://chartshots.spotware.com/c/69278f8b6d973
Logika: Gdy próg zostanie przekroczony, tworzy "strefę" opartą na maksimum/minimum świecy w momencie przekroczenia. Następnie: 🧠
- Koloruje świece wewnątrz tej strefy.
- Rysuje kanał (maksimum, minimum, środek).
- Oznacza przekroczenie na panelu RSI kółkiem i etykietą.
Strefa trwa dokładnie MinZoneDuration świec. ⏱️
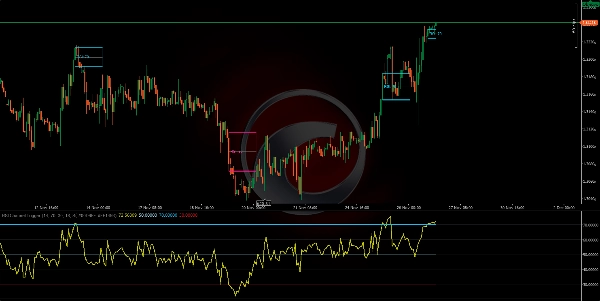
Wyraźne sygnały:
- Przekroczenie powyżej wykupienia → inicjuje strefę byczą. 🟢
- Przekroczenie poniżej wyprzedania → inicjuje strefę niedźwiedzią. 🔴
Sama strefa jest obszarem zainteresowania, a nie zleceniem.
https://chartshots.spotware.com/c/69278fb274e0b
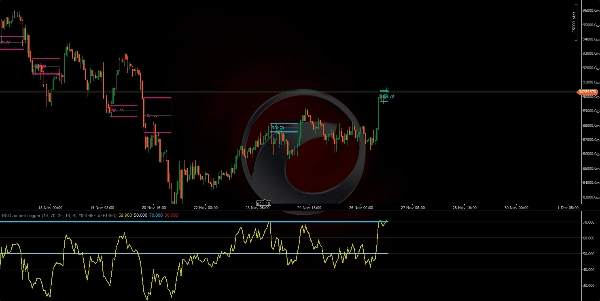
Jak używać (szybko):
- Poczekaj na utworzenie strefy. 🎯
- Potwierdź za pomocą akcji cenowej (wybicie/odrzucenie od linii kanału).
- Wejdź z stop lossem poza strefą i celem na linii środkowej kanału lub określonym stosunku ryzyka do zysku.
https://chartshots.spotware.com/c/69278fe76237b
Kluczowe parametry: ⚙️
- Okres RSI (14)
- Wykupienie (70)
- Wyprzedanie (30)
- MinZoneDuration (15)
- Konfigurowalne kolory 🎨
Podsumowanie
Clear signals include:
- RSI crossing above the overbought level, initiating a bullish momentum zone.
- RSI crossing below the oversold level, initiating a bearish momentum zone.
These zones serve as areas of interest rather than direct trade orders. Users can confirm signals with price action such as breakouts or rejections from channel lines and plan entries with stop losses placed outside the zone and targets at the mid-channel line or based on risk/reward ratios.
The indicator supports multiple markets and symbols including Forex pairs (EURUSD, GBPUSD, NZDUSD, USDJPY), commodities (XAUUSD), indices (NAS100), cryptocurrencies (BTCUSD), and stocks. It offers configurable parameters for RSI period, threshold levels, zone duration, and colors.


![Logo „Smart Money Concepts (SMC) [Iridio Capital]”](https://cdn.ctrader.com/image/webp/28b69fd1-ef54-4bed-9487-07e78e883be4_40934)