Descrizione
Indicatore di Massimi e Minimi Principali: Una Panoramica Completa
Introduzione
Nel mondo frenetico del trading, avere gli strumenti giusti a disposizione può fare tutta la differenza. L'indicatore di Massimi e Minimi Principali è progettato per identificare i punti di svolta critici nel mercato, permettendo ai trader di prendere decisioni informate. Questo potente strumento sfrutta algoritmi avanzati per individuare massimi e minimi significativi, migliorando la tua strategia di trading e aumentando le tue prestazioni complessive. Con un tasso medio di accuratezza intorno al 60% - 70% sul timeframe di 45 minuti, questo indicatore è una risorsa affidabile per i trader che vogliono capitalizzare sui movimenti di mercato, rendendolo ideale sia per day trader che per scalper.
Caratteristiche Principali
1. Rappresentazione Visiva
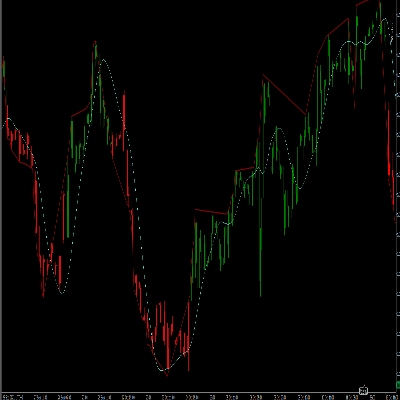
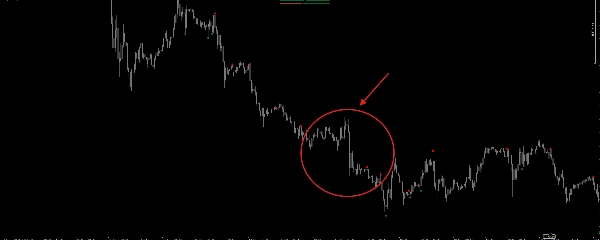
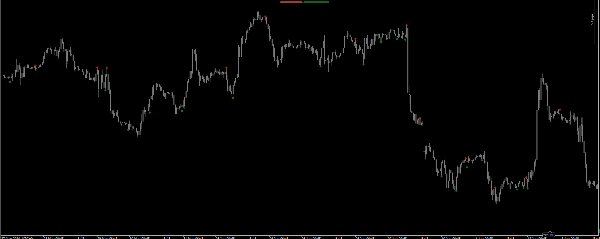
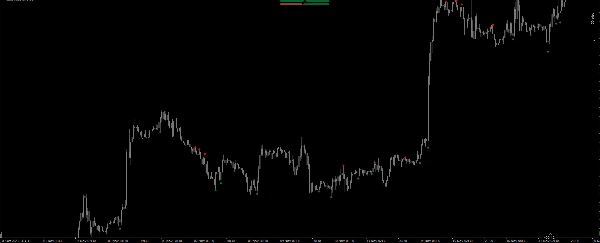
L'indicatore di Massimi e Minimi Principali fornisce una chiara rappresentazione visiva della dinamica di mercato. Con i massimi principali segnati in rosso e i minimi principali in verde, i trader possono identificare rapidamente i potenziali punti di inversione. L'uso di punti assicura che questi livelli critici risaltino sul grafico, facilitando l'individuazione delle opportunità di trading a colpo d'occhio.
2. Calcoli Precisi
Il cuore dell'indicatore di Massimi e Minimi Principali risiede nel suo metodo di calcolo. Analizzando l'azione del prezzo delle ultime quattro barre, l'indicatore determina se si è formato un massimo o un minimo principale. Ciò avviene attraverso una serie di confronti tra i prezzi massimi e minimi, garantendo che vengano identificati solo i punti di svolta significativi.
3. Tecniche di Scalping Avanzate
Per i trader specializzati nello scalping, l'indicatore di Massimi e Minimi Principali è una risorsa preziosa. Identificando i punti di svolta chiave, i trader possono entrare e uscire dalle posizioni con precisione. La capacità di individuare rapidamente massimi e minimi principali consente di posizionare take profit (TP) e stop loss (SL) stretti, minimizzando il rischio e massimizzando i potenziali guadagni. Dato il suo tasso di accuratezza intorno al 60% - 70% su timeframe di 45 minuti, è altamente consigliato utilizzare stop loss per mitigare le perdite potenziali quando un segnale viene mancato.
Vantaggi dell'Uso dell'Indicatore di Massimi e Minimi Principali
1. Migliore Processo Decisionale
L'indicatore di Massimi e Minimi Principali consente ai trader di prendere decisioni informate basate su un'analisi di mercato accurata. Identificando massimi e minimi significativi, i trader possono anticipare meglio i movimenti dei prezzi e adattare di conseguenza le loro strategie. Questo processo decisionale migliorato aumenta le prestazioni complessive del trading.
2. Maggior Potenziale di Profitto
Con la capacità di individuare punti di svolta critici, i trader possono capitalizzare più efficacemente sulle inversioni di mercato. L'indicatore di Massimi e Minimi Principali permette ai trader di entrare nelle posizioni nei momenti ottimali, aumentando il loro potenziale di profitto. Utilizzando livelli stretti di TP e SL, i trader possono massimizzare i guadagni minimizzando l'esposizione al rischio.
3. Interfaccia Intuitiva
L'indicatore di Massimi e Minimi Principali è progettato tenendo conto dell'esperienza dell'utente. La chiara rappresentazione visiva dei massimi e minimi principali assicura che i trader possano interpretare facilmente i segnali forniti dall'indicatore. Questa interfaccia intuitiva lo rende accessibile a trader di tutti i livelli di esperienza.
4. Applicazione Versatile
Che tu sia un day trader, swing trader o scalper, l'indicatore di Massimi e Minimi Principali può essere applicato a diverse strategie di trading. La sua versatilità lo rende un'aggiunta preziosa alla cassetta degli attrezzi di qualsiasi trader, permettendo una maggiore flessibilità nell'adattarsi a differenti condizioni di mercato.
Conclusione
In conclusione, l'indicatore di Massimi e Minimi Principali è uno strumento potente che migliora le strategie di trading identificando i punti di svolta critici del mercato. Con i suoi calcoli accurati, la rappresentazione visiva e la compatibilità con la piattaforma cTrader, questo indicatore permette ai trader di prendere decisioni informate e capitalizzare sui movimenti di mercato. Con un tasso di accuratezza intorno al 70%, è fondamentale implementare stop loss per minimizzare le perdite quando un segnale viene mancato. Per risultati ottimali, si consiglia di utilizzare questo indicatore su un timeframe di 45 minuti. Che tu sia un trader esperto o alle prime armi, l'indicatore di Massimi e Minimi Principali può migliorare significativamente le tue prestazioni di trading. Eleva oggi la tua esperienza di trading incorporando questo strumento innovativo nella tua strategia.
Riepilogo
Recensioni dei clienti
5 | 50 % | |
4 | 50 % | |
3 | 0 % | |
2 | 0 % | |
1 | 0 % |