
说明
📈 AutoFibRetracement 指标
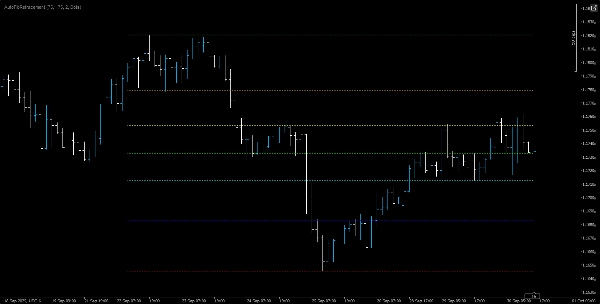
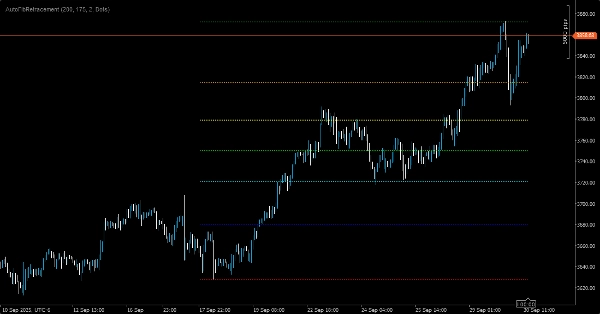
AutoFibRetracement 指标是一款强大的叠加工具,旨在根据最近的价格波动自动绘制斐波那契回撤水平。非常适合寻求识别潜在支撑和阻力区域的交易者,该指标使用可自定义参数动态计算回撤水平,并直接显示在图表上。
🔧 主要功能:
• 自动波动检测:计算用户定义回溯窗口内的波动高点和低点。
• 可自定义周期窗口: 交易者必须选择合适的窗口,以准确捕捉有意义的波动高点和低点。此选择对于使回撤水平与实际市场结构对齐至关重要。
• 斐波那契水平:包括标准比率——0%、23.6%、38.2%、50%、61.8%、78.6% 和 100%——每个均有颜色编码以增强视觉清晰度。
• 视觉样式选项:
• 可调节的不透明度(0–255)以控制线条透明度。
• 可配置的线条粗细和样式(例如,点状、实线)。
• 叠加显示:直接绘制在价格图表上,实现与其他技术分析工具的无缝集成。
🎯 使用场景:
非常适合波段交易者、趋势跟随者和依赖斐波那契回撤区域来规划入场、出场及止损水平的技术分析师。该指标的有效性取决于交易者选择正确窗口大小的能力——窗口过短可能错过更广泛的波动,窗口过长可能稀释近期价格动作。
摘要
AI 摘要
AutoFibRetracement is a technical indicator overlay tool that automatically plots Fibonacci retracement levels on price charts. It detects recent swing highs and lows within a user-defined lookback window to calculate key Fibonacci levels—0%, 23.6%, 38.2%, 50%, 61.8%, 78.6%, and 100%—which are color-coded for clarity. The indicator offers customizable visual settings including line opacity, thickness, and style, allowing seamless integration with other chart elements. Designed for traders who use Fibonacci retracements to identify potential support and resistance zones, it supports various symbols such as BTCUSD, EURUSD, GBPUSD, XAUUSD, NAS100, and USDJPY. The effectiveness depends on selecting an appropriate period window to capture meaningful market swings. This tool is suitable for swing traders, trend followers, and technical analysts aiming to plan entries, exits, and stop-loss levels based on Fibonacci zones.
指标配置
客户评价
0.0
评价:0
客户评价
该产品尚无评价。已经试过了?抢先告诉其他人!
讨论
常见问答
BTCUSD
Fibonacci
Scalping
EURUSD
GBPUSD
Grid
XAUUSD
NAS100
USDJPY
cTrader Store 提供的所有产品,包括交易机器人、指标和插件,均由第三方开发者提供,仅供信息参考和技术访问之用。cTrader Store 并非经纪商,不提供投资建议、个人推荐或任何未来业绩保证。


!["[Stellar Strategies] MARSI Signal Plotter" 标识](https://cdn.ctrader.com/image/webp/7b2b8da6-8f8e-4646-8d4a-4710c516c01e_25567)


价格
26
销售
2.16K
免费安装