
说明
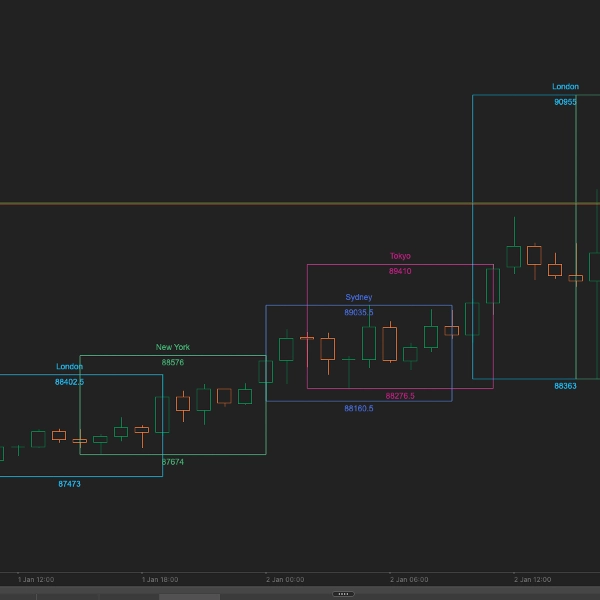
准确了解主要市场的开盘和收盘时间。FX Market Sessions 显示四个关键交易时段及其高低点,帮助您在一天中最波动的时段安排入场时机。
主要功能
- 四大交易时段:悉尼、东京、伦敦和纽约时段,显示可自定义的开始/结束时间并自动调整夏令时
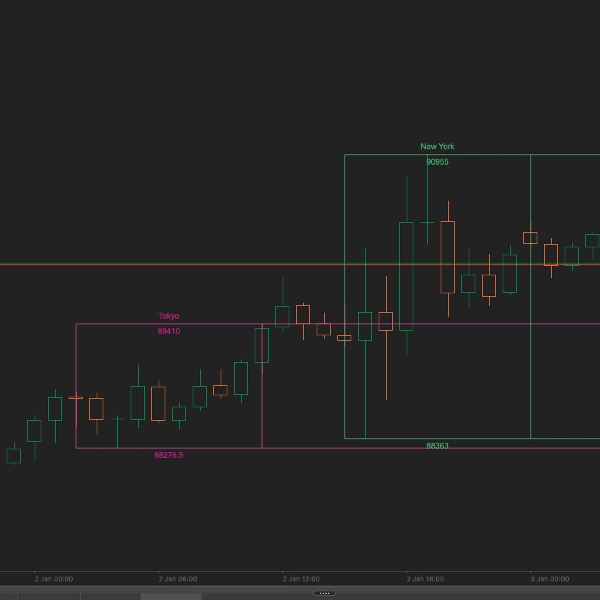
- 时段高低点:自动跟踪并显示每个时段的高点和低点,带有可延伸的线条以便支撑/阻力规划
- 实时时段显示:实时信息面板显示当前开放的时段——不再猜测伦敦或纽约何时开始
- 历史背景:查看最多10天的过去时段水平,了解价格在关键时段边界的反应
- 完全自定义:选择显示哪些时段,挑选自定义颜色,并决定是否无限延伸高低点
工作原理
该指标根据各自的本地时区自动计算四个主要外汇交易时段:
- 悉尼:21:00-06:00 AEST(自动调整夏令时)
- 东京:00:00-09:00 JST
- 伦敦:08:00-17:00 GMT(自动调整夏令时)
- 纽约:13:00-22:00 EST(自动调整夏令时)
每个时段以垂直区域绘制,并标记其高点和低点。右上角的信息面板实时显示当前开放的时段。
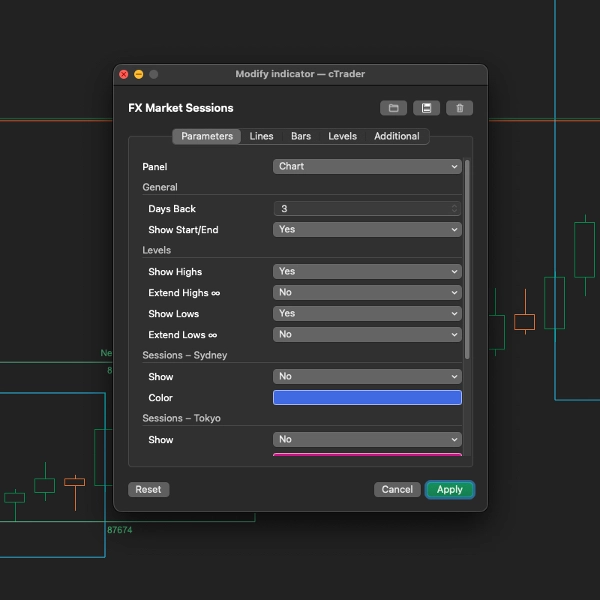
参数
通用设置
- 回溯天数(默认:3):显示时段框的历史天数(0-10)
- 显示开始/结束(默认:True):在时段开盘和收盘时间绘制垂直线
水平设置
- 显示高点(默认:True):显示每个时段的高点
- 延伸高点(默认:False):将高点线延伸至图表右边缘
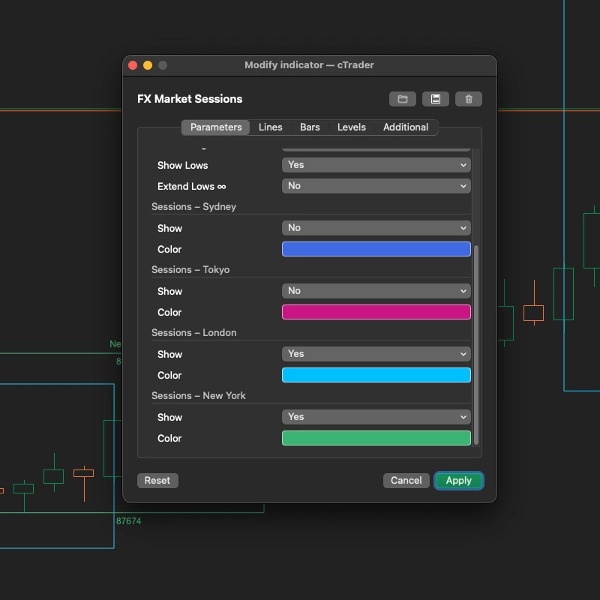
- 显示低点(默认:True):显示每个时段的低点
- 延伸低点(默认:False):将低点线延伸至图表右边缘
时段设置(悉尼、东京、伦敦、纽约)
- 显示:启用或禁用单个时段
- 颜色:为每个时段的显示元素选择自定义颜色
适用对象
- 需要了解波动性何时增加的日内交易者
- 交易时段开盘突破的交易者
- 使用时段高低点作为支撑/阻力的交易者
- 任何想要直观了解最佳交易时间的人
交易提示
- 伦敦开盘:最具波动性的时段之一——通常决定当天的方向
- 伦敦/纽约重叠:13:00-16:00 GMT 通常拥有最高的成交量和波动性
- 亚洲时段:适合交易日元和澳元货币对
- 时段突破:价格突破时段高点/低点可能预示趋势延续
支持的时间框架
在 M5 到 H4 时间框架上表现最佳。指标会自动调整时段框以适应您的图表比例。
摘要
AI 摘要
FX Market Sessions is an indicator designed for forex traders to visualize the four major trading sessions—Sydney, Tokyo, London, and New York—directly on their charts. It automatically calculates session times based on local time zones and adjusts for daylight saving time. The indicator marks session start and end times with optional vertical lines and displays each session as a colored zone.
Key features include automatic plotting of session high and low price levels, with options to extend these levels across the chart for support and resistance analysis. A live info panel shows which sessions are currently open in real-time. Users can customize which sessions to display, adjust colors, and set how many past days (up to 10) of session data to show, excluding weekends.
The indicator is optimized for intraday timeframes, working best on 5-minute to 4-hour charts. It provides historical context by showing previous session levels, aiding traders in timing entries around periods of increased volatility such as the London open and the London/New York overlap. This tool supports trading strategies that rely on session timing and price levels for breakout and intraday trading decisions.
指标配置
客户评价
5.0
评价:6
5 | 100 % | |
4 | 0 % | |
3 | 0 % | |
2 | 0 % | |
1 | 0 % |
客户评价
December 23, 2025
August 12, 2025
Pros: Highlights Tokyo, London, and New York sessions with custom colors. Ultra-light performance. Clean and intuitive display. Cons: No alerts or tooltips. Missing template saving. Provides no trading signals by itself.
May 13, 2025
It's a five star review from me. I've been searching for market session indicator until I found this. Best market session indicator!
讨论
常见问答
Forex
EURUSD
GBPUSD
XAUUSD
USDJPY
cTrader Store 提供的所有产品,包括交易机器人、指标和插件,均由第三方开发者提供,仅供信息参考和技术访问之用。cTrader Store 并非经纪商,不提供投资建议、个人推荐或任何未来业绩保证。


价格
注册日期 04/04/2025
8
销售
1.95K
免费安装