
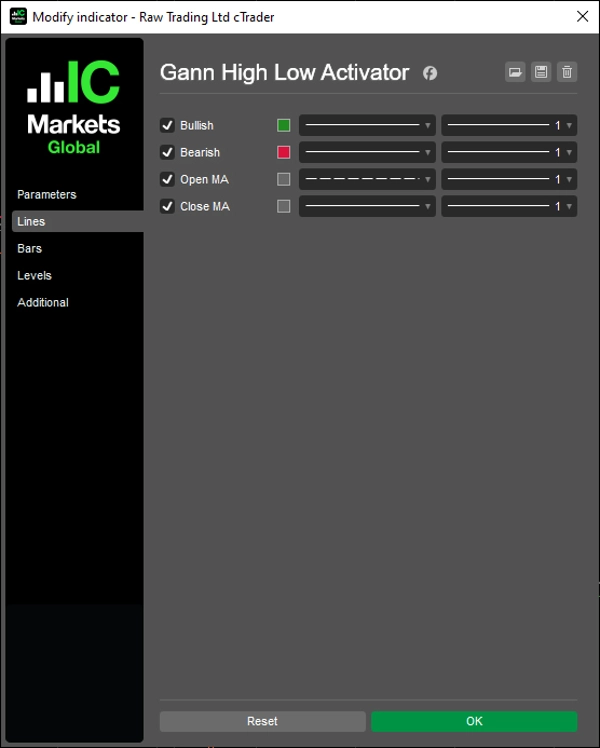

Penerangan
Pengaktifan trend berasaskan MA dengan mod multi-masa dan unjuran garis trend.
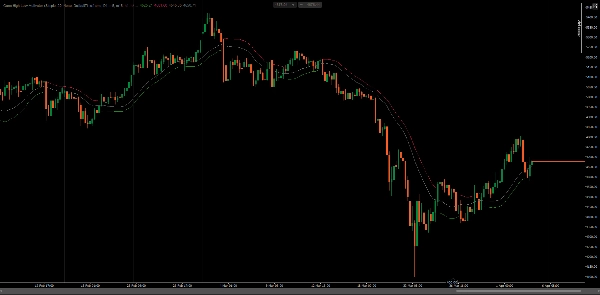
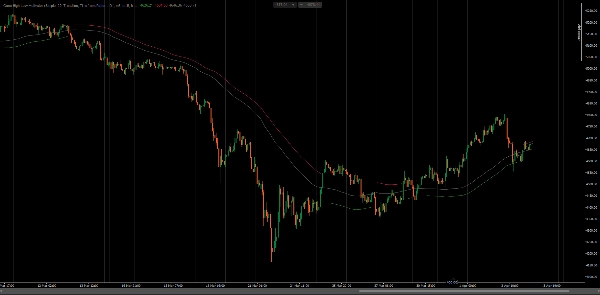
Mengikuti arah pasaran dengan membandingkan harga tutup terhadap purata bergerak bagi Harga Tinggi dan Rendah sepanjang tempoh yang boleh dikonfigurasikan. Berubah keadaan apabila harga tutup melintasi ke atas MA(Harga Tinggi) menjadi bullish atau ke bawah MA(Harga Rendah) menjadi bearish — memplot jalur bertentangan sebagai tahap sokongan atau rintangan aktif.
Empat mod pengiraan (Tiada, Interpolasi, SkalaTempoh, GarisTrend), output MA Buka dan Tutup, resolusi corak jangka masa untuk pemilihan HTF automatik, dan unjuran garis trend untuk anggaran bar seterusnya menyediakan rangka kerja lengkap mengikuti trend untuk pedagang yang bekerja merentas pelbagai jangka masa dan gaya analisis.
CIRI-CIRI
Logik Pengaktifan Teras
- Keadaan bullish: dicetuskan apabila harga tutup melintasi ke atas MA(Harga Tinggi) — memplot MA(Harga Rendah) sebagai sokongan dinamik
- Keadaan bearish: dicetuskan apabila harga tutup melintasi ke bawah MA(Harga Rendah) — memplot MA(Harga Tinggi) sebagai rintangan dinamik
- Output MA Buka dan MA Tutup untuk analisis konfluens dan lapisan tambahan
- Menyokong semua jenis purata bergerak cTrader (SMA, EMA, DEMA, TEMA, WMA, dll.)
Mod Multi-Jangka Masa
- Tiada: pengiraan jangka masa tunggal standard pada carta semasa
- Interpolasi: nilai HTF yang lancar dipetakan secara linear ke bar LTF untuk lapisan berterusan
- SkalaTempoh: menskala tempoh mengikut nisbah HTF-ke-LTF — tiada siri data tambahan diperlukan
- GarisTrend: melukis objek garis trend carta antara sempadan bar HTF dengan kawalan gaya penuh
Resolusi Jangka Masa
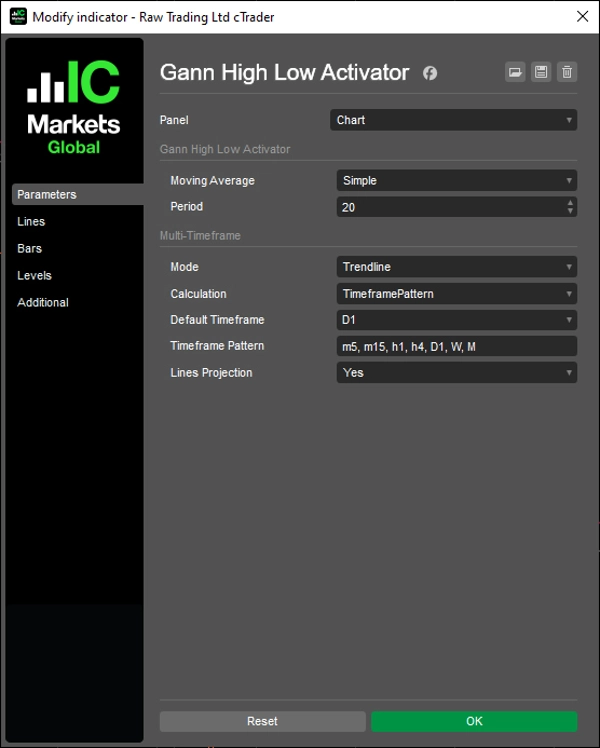
- JangkaMasaDefault: pilih secara manual mana-mana HTF dari dropdown parameter
- CorakJangkaMasa: memilih automatik jangka masa lebih tinggi terdekat dari senarai token yang dipisahkan koma (contoh,
m5, m15, h1, h4, D1, W, M) - Token corak menyokong minit (m1–m45), jam (h1–h12), hari (d1–d3), mingguan (W), dan bulanan (M)
Tambahan Mod GarisTrend
- Kawalan warna, ketebalan, dan gaya bebas bagi setiap garis output
- Togol keterlihatan membina semula semua segmen secara automatik — tiada objek lapuk
- Segmen unjuran memanjangkan segmen HTF terakhir satu bar ke hadapan untuk jangkaan
Penyesuaian Penuh
- Jenis dan tempoh MA yang boleh dikonfigurasikan
- Gaya garis per output diwarisi oleh objek garis trend dalam mod GarisTrend
- Fallback bersih ke jangka masa semasa apabila HTF ≤ jangka masa carta
- Kawalan Panjang Garis untuk pengurusan julat paparan
- Panel UI pada carta untuk pelarasan parameter masa nyata tanpa membuka tetapan
Panjang Garis
- Mengawal sejauh mana garis dipaparkan ke belakang — dari Jam8 hingga Tahun10
Digunakan untuk semua mod: output siri dan objek garis trend
Kawalan UI
- Panel combobox pada carta untuk akses cepat ke Jenis MA, Mod MTF, Pengiraan, Jangka Masa, dan Panjang Garis
- Posisi boleh dikonfigurasikan: KiriAtas, KananAtas, KiriBawah, KananBawah, atau tersembunyi (Tiada)
__________________________________________________________________________________________
LAGI PENUNJUK PERCUMA
Terokai pelbagai alat analisis pasaran—daripada struktur dan volum kepada regresi, volatiliti, dan jangka masa tersuai.
Kod sumber tersedia di repositori GitHub repository.
Semua percuma untuk digunakan. Tetapi jika anda ingin menyokong dengan kopi, anda boleh salurkan ia di sini.
Sokongan/Rintangan
Volum
- Profiler Aktiviti Volum
- Penganalisis Kecekapan Volum
- Analitik Profil Volum
- Profil Volum - Dikemaskini
- Analisis Sebaran Volum
- VWAP (Harga Purata Berwajaran Volum)
Purata Bergerak
- Saluran SSL
- Purata Bergerak Berjangkar
- Purata Bergerak Skala Deviasi
- Pengaktif Tinggi Rendah Gann
- Garis Trend Segera
- MA Adaptif Kaufman dengan Visi Trend
- Saluran Purata Bergerak
- Set Purata Bergerak
- Purata Bergerak Saluran Trend
Utiliti/Tersuai
Berasaskan Regresi
Volatiliti
Pengayun
__________________________________________________________________________________________
PENAFIAN
Perdagangan melibatkan risiko. Penunjuk ini bertujuan untuk analisis teknikal sahaja — sentiasa gunakan pengurusan risiko yang betul dan berdagang dengan bertanggungjawab.
MAKLUMBALAS & PENAMBAHBAIKAN
Jika anda mempunyai cadangan, permintaan ciri, atau idea untuk penambahbaikan, sila tinggalkan komen di tab Perbincangan. Maklum balas anda membantu memperbaiki penunjuk untuk semua orang.
Ringkasan
Key features include four multi-timeframe calculation modes—None (single timeframe), Interpolated (smoothed higher timeframe values), ScaledPeriod (period scaled by timeframe ratio), and Trendline (trendline objects between higher timeframe bars with style control). It supports all cTrader MA types (SMA, EMA, DEMA, TEMA, WMA, etc.) and offers Open and Close MA outputs for additional analysis.
Timeframe resolution options allow manual or automatic selection of higher timeframes based on customizable token patterns. Trendline mode provides independent styling and projects the trendline forward by one bar for anticipation. The indicator includes extensive customization for MA type, period, line styles, display length, and an on-chart UI panel for runtime parameter adjustments. It is suitable for traders applying trend-following techniques across multiple symbols and timeframes.
Perbincangan
Ulasan pelanggan
Soalan Lazim
Lebih banyak produk daripada penulis ini






![Logo "Session Volume Profile (SVP) [Iridio Capital]"](https://cdn.ctrader.com/image/webp/b058beb7-b143-45f3-87d0-8c524c00b203_61552)














Harga