Beschreibung
📈 pATR – Perzentil-Durchschnittlicher True Range
Präzise Volatilität. Intelligenteres Risiko. Institutioneller Vorteil.
Der pATR Indikator definiert den traditionellen ATR neu, indem er einen perzentilbasierten Filter auf die jüngsten True Range-Werte anwendet und Händlern so eine statistisch fundierte Sicht auf die Volatilität bietet. Anstatt sich auf einfache Durchschnitte zu verlassen, berechnet pATR das n-te Perzentil der jüngsten Preisbewegungsintensität – was Ihnen hilft, Ausbruchsbereiche, Fade-Setups und Risikoschwellen mit chirurgischer Genauigkeit zu identifizieren.
Egal, ob Sie Herausforderungen bei Prop-Firmen meistern oder Ihre Scalping-Strategie verfeinern, pATR liefert eine dynamische Volatilitätsbenchmark, die sich an Marktbedingungen anpasst und Ihr Risiko kalibriert hält.
🔍 Hauptmerkmale
• Perzentilbasierter ATR: Filtert Rauschen und Ausreißer für sauberere Volatilitätssignale
• Zirkuläre Pufferlogik: Optimiert für Geschwindigkeit und Speichereffizienz – kein Verzögerung, keine Unordnung
• Challenge-Modus Bereit: Ideal für Prop-Firmen-Händler, die Drawdown- und Handelslimits verwalten
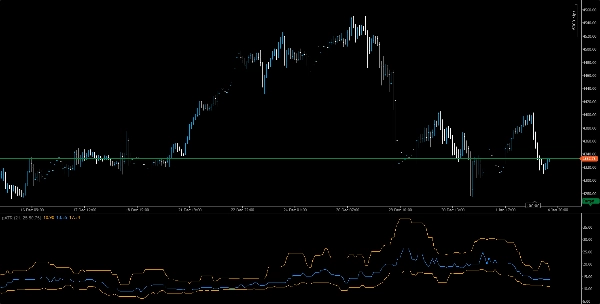
• Saubere Visualisierung: Orangefarbene Volatilitätslinie mit intuitiver Skalierung und Overlay-Optionen
• Multi-Timeframe-Kompatibel: Verwendbar von M1 bis H1 für Ausbruch-, Fade- oder Trend-Setups
🧠 Anwendungsfälle
• Ausbruchbestätigung: Nutzen Sie pATR-Spitzen zur Validierung von Momentum-Einstiegen
• Risikokalibrierung: Richten Sie Stop-Loss und Positionsgrößen an der Perzentil-Volatilität aus
• Strategie-Backtesting:Validieren Sie Setups mit konsistenten Volatilitätsschwellen
🎯 Für wen es gedacht ist
• Prop-Firmen-Händler, die regelbasiertes Risikomanagement suchen
• Scalper und Intraday-Strategen, die adaptive Volatilitätsfilter benötigen
• Quantitative Händler, die Perzentillogik in benutzerdefinierte Systeme integrieren
• Ausbilder und Mentoren, die volatilitätsbewusste Ausführung lehren
Zusammenfassung
Key features include an orange volatility line with intuitive scaling and overlay options, compatibility across multiple timeframes from 1-minute to 1-hour charts, and suitability for prop firm traders managing drawdowns and trade limits. pATR helps traders identify breakout zones, fade setups, and risk thresholds with precision.
Use cases cover breakout confirmation through volatility spikes, risk calibration by aligning stop-loss and position sizing with percentile volatility, and strategy backtesting using consistent volatility benchmarks. The indicator is designed for prop firm traders, scalpers, intraday strategists, quantitative traders integrating percentile logic, and educators focusing on volatility-aware execution.
Supported markets include Forex, stocks, indices, commodities, and cryptocurrencies, making pATR a versatile tool for various trading environments.