Calculadora
Indikator
6 downloads
Version 1.0, Jul 2025
Windows, Mac

Beschreibung
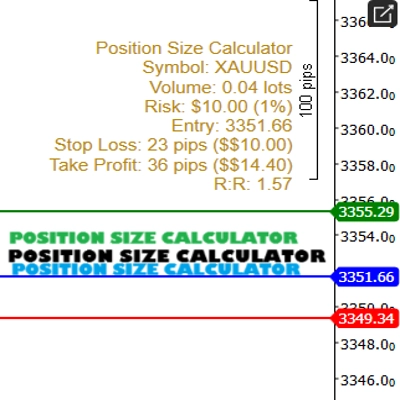
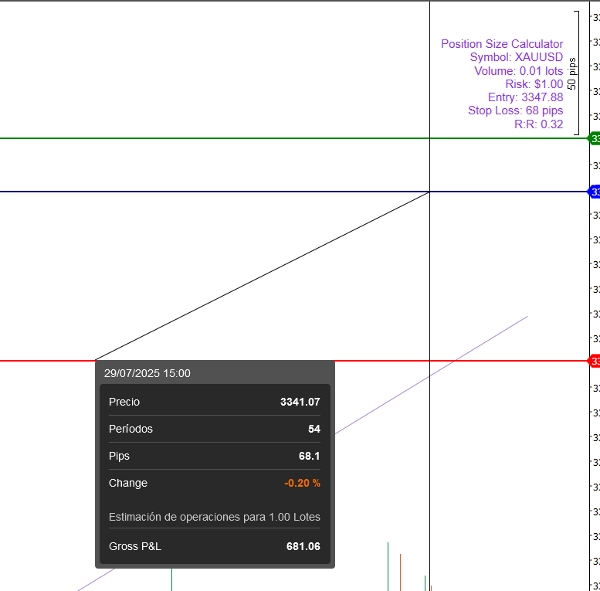
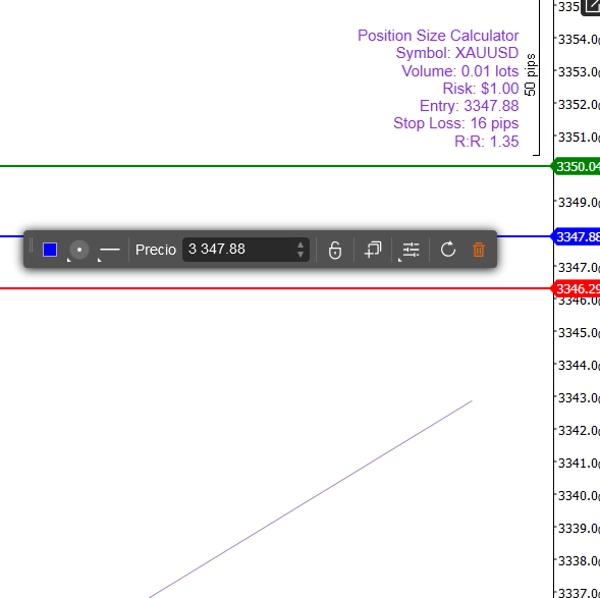
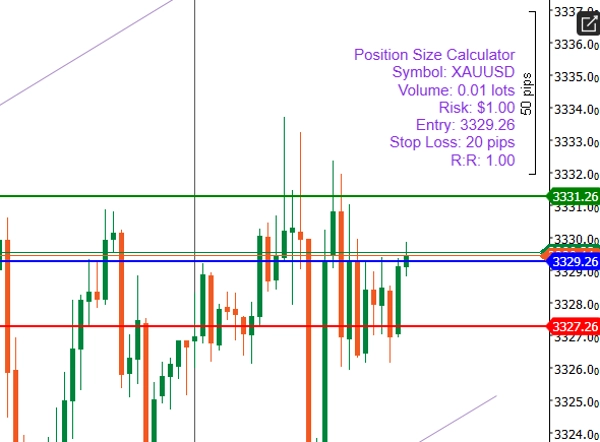
- Du wirst drei Linien sehen: Entry (blau), SL (rot), TP (grün).
- Ziehe die Linien, um die Niveaus anzupassen. Der Text wird automatisch aktualisiert.
Zusammenfassung
Indikatorprofil
Kundenbewertungen
0.0
Bewertungen: 0
Kundenbewertungen
Bisher gibt es keine Bewertungen für dieses Produkt. Haben Sie es schon ausprobiert? Dann können Sie die erste Person sein, die andere darüber informiert!
Diskussion
Häufig gestellte Fragen (FAQ)
Über den cTrader Store verfügbare Produkte, einschließlich Handelsbots, Indikatoren und Plugins, werden von externen Entwicklern bereitgestellt und nur zu Informations- und technischen Zugriffszwecken verfügbar gemacht. cTrader Store ist kein Broker und erbringt keine Anlageberatung, persönlichen Empfehlungen oder eine Garantie für zukünftige Performance.
Mehr von diesem Autor


Preis
412.95K
Gehandeltes Volumen
24.92K
Pip-Gewinn
6
Verkäufe
647
Kostenlose Installationen