
Beschreibung
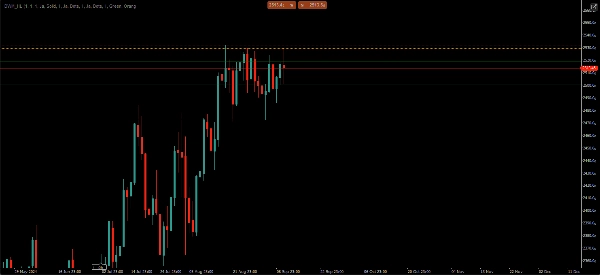
NGS Liquiditätsniveaus – Tägliche • Wöchentliche • Monatliche Hochs & Tiefs
Handeln Sie um Liquidität herum, nicht um zufällige Linien.
NGS Liquiditätsniveaus zeigt automatisch die wichtigsten täglichen, wöchentlichen und monatlichen Liquiditätsniveaus in jedem Chart an.
• Kein manuelles Zeichnen
• Kein Zeitrahmenwechsel
• Keine Chart-Unordnung
Dieser benutzerfreundliche Indikator hilft Tradern, wichtige Liquiditäts- und Marktstruktur-Niveaus innerhalb von Sekunden zu identifizieren. Anstatt täglich manuell Hochs und Tiefs zu markieren, werden die wichtigsten Niveaus automatisch angezeigt und für Sie aktualisiert.
Funktionen:
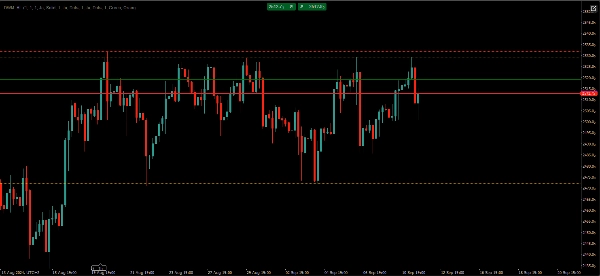
• Automatische tägliche Hoch- & Tief-Niveaus
• Automatische wöchentliche Hoch- & Tief-Niveaus
• Automatische monatliche Hoch- & Tief-Niveaus
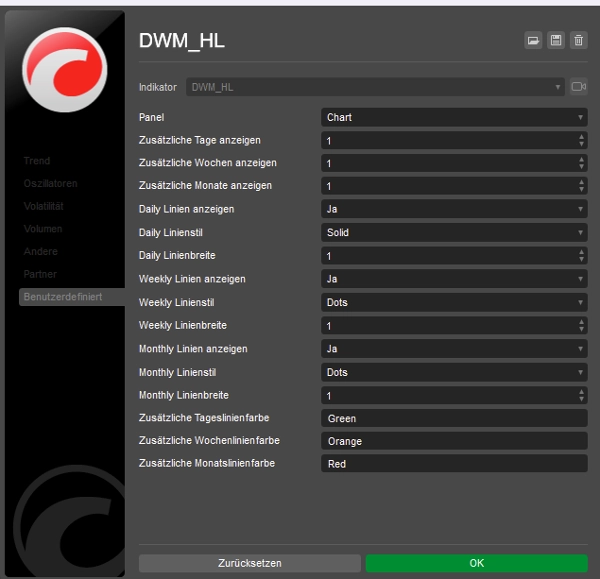
• Optionale Niveaus der vorherigen Periode
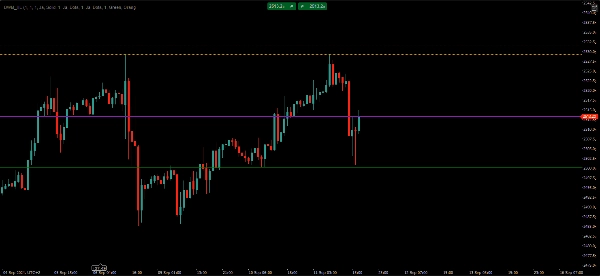
• Anpassbare Farben und Linienarten
• Saubere und leichte Chart-Darstellung
• Funktioniert über Forex, Indizes, Rohstoffe und Krypto
• Unterstützt mehrere Zeitrahmen
• Kein Neuzeichnen
Entwickelt für Trader, die sich auf Marktstruktur, Liquidität und höhere Zeitrahmenniveaus konzentrieren.
Keine Signale.
Keine Strategie.
Keine Gewinnversprechen.
Nur objektive Liquiditätsniveaus und ein saubererer Handelsworkflow.
Zusammenfassung
Kundenbewertungen
5 | 100 % | |
4 | 0 % | |
3 | 0 % | |
2 | 0 % | |
1 | 0 % |


