Descripción
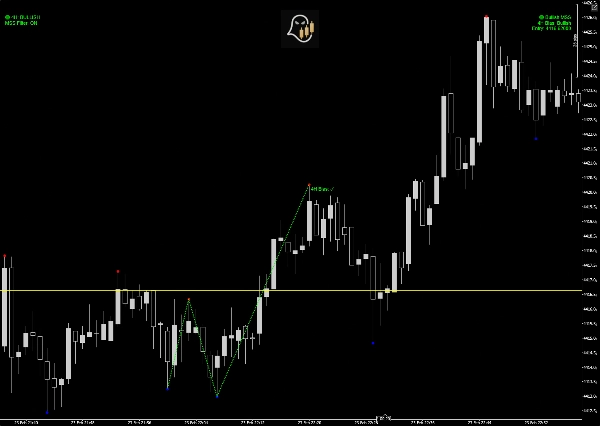
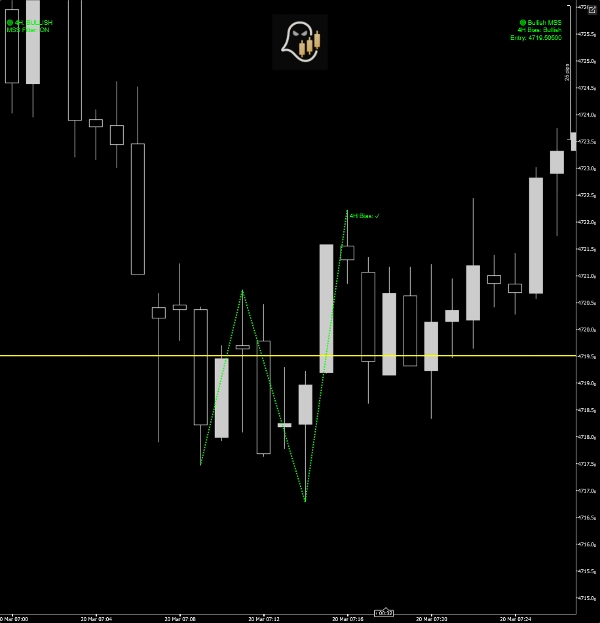
El indicador detecta MSS (Cambio en la Estructura del Mercado) patrones construidos a partir de máximos y mínimos fractales.
Un MSS válido requiere:
- Una secuencia de 4 puntos de oscilación fractales
- Una ruptura de la estructura de oscilación previa
- Confirmación en la dirección opuesta
- Confirmación opcional desde la tendencia de 4H
Cuando se detecta, el indicador proporciona:
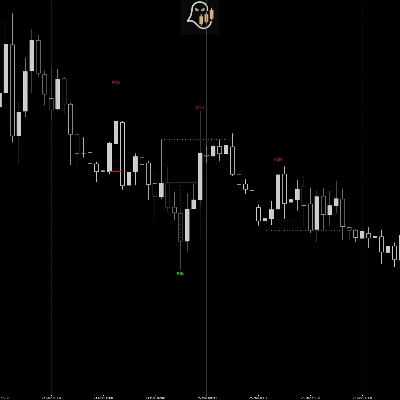
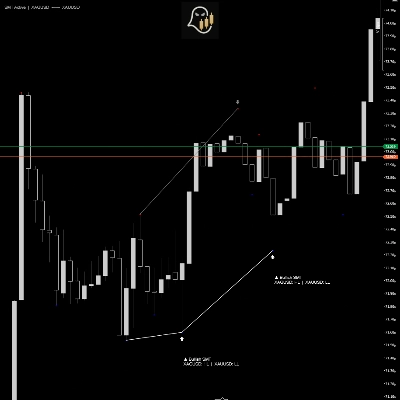
- Líneas visuales del patrón
- Nivel de entrada Fibonacci (50%)
- Panel de alertas en el gráfico
- Alerta sonora opcional
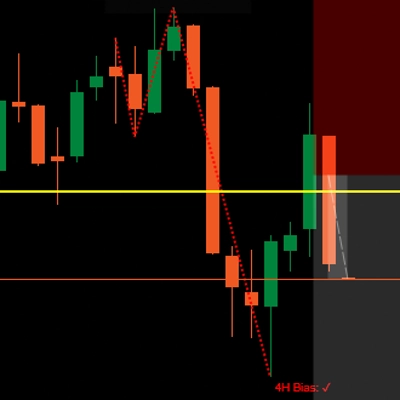
- Visualización de la dirección de la tendencia
FILTRO DE TENDENCIA DE 4 HORAS
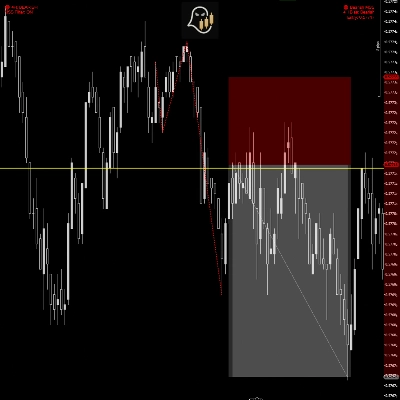
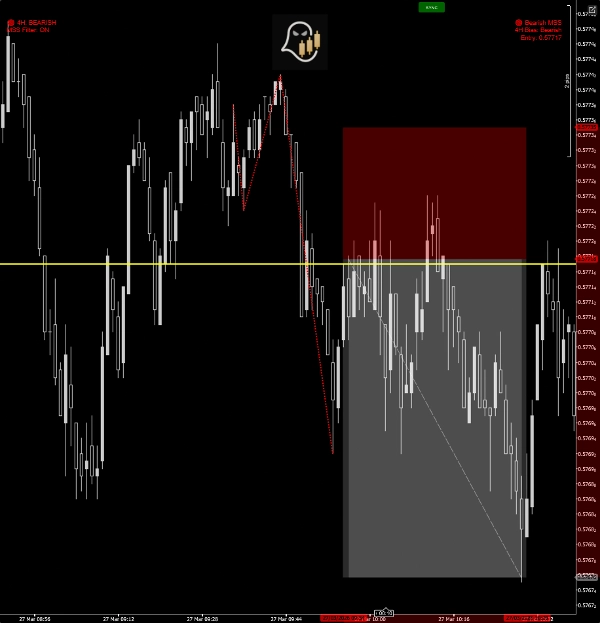
Cuando está habilitado, el indicador filtra señales usando la vela 4H previa.
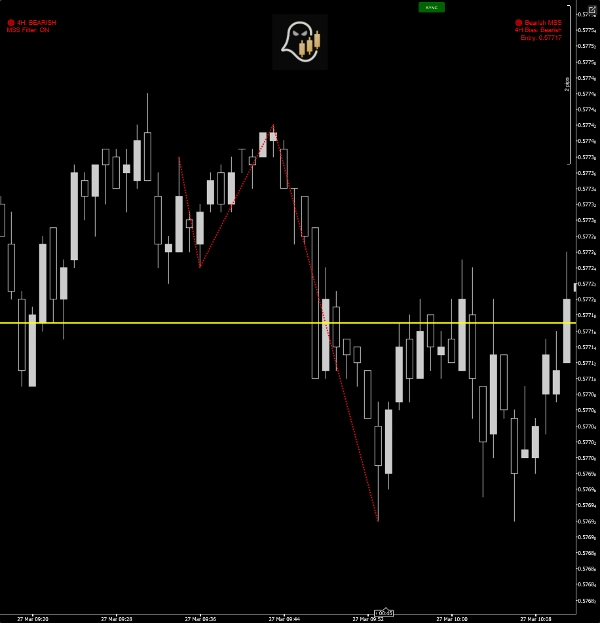
- Vela 4H alcista → solo se muestran MSS alcistas
- Vela 4H bajista → solo se muestran MSS bajistas
Esto previene operar en contra del impulso de un marco temporal superior.
La tendencia se actualiza automáticamente cada pocos minutos y se muestra en el gráfico.
NIVEL DE ENTRADA FIBONACCI
Después de detectar MSS, el indicador calcula:
Retracción del 50% entre los dos últimos puntos de oscilación
Este nivel representa:
- Zona de reentrada institucional
- Área óptima de retroceso
- Precio de entrada eficiente en riesgo
El nivel se dibuja como una línea horizontal.
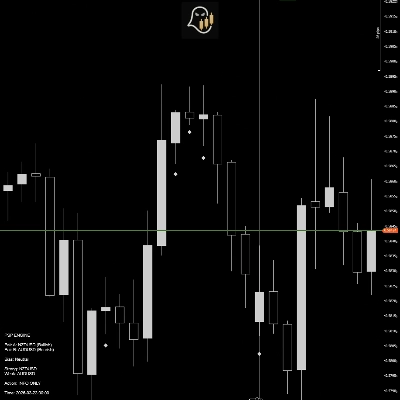
SALIDAS VISUALES
Cuando se forma un patrón, el indicador muestra:
✔ Líneas del patrón
Conecta visualmente los puntos de oscilación
✔ Nivel Fibonacci 50%
Zona de entrada resaltada en el gráfico
✔ Panel de visualización de la tendencia
Muestra la tendencia direccional actual de 4H
✔ Panel de alertas MSS
Muestra la señal activa y el nivel de entrada
✔ Alerta sonora (opcional)
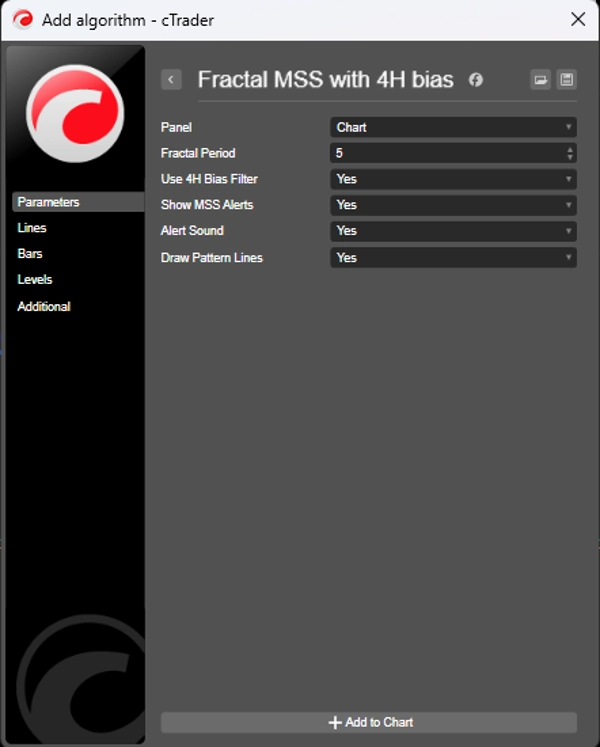
PARÁMETROS DE ENTRADA
Periodo Fractal
Controla la sensibilidad de las oscilaciones.
- Valor más bajo → más señales
- Valor más alto → solo oscilaciones más fuertes
Usar filtro de tendencia 4H
Filtra señales basadas en un marco temporal superior.
Recomendado: ACTIVADO
Mostrar alertas MSS
Muestra texto de señal en el gráfico.
Sonido de alerta
Reproduce una notificación cuando se forma un MSS.
Dibujar líneas del patrón
Muestra la estructura visual en el gráfico.
Desactiva si solo quieres alertas.
CÓMO OPERAR CON EL INDICADOR
Paso 1
Espera la detección del MSS.
Paso 2
Confirma la alineación de la tendencia.
Paso 3
Marca el nivel Fibonacci del 50%.
Paso 4
Espera que el precio retroceda hacia la zona.
Paso 5
Entra en la dirección del MSS.
Resumen
Valoraciones de clientes
5 | 50 % | |
4 | 50 % | |
3 | 0 % | |
2 | 0 % | |
1 | 0 % |