
Indicador de Caza de Ballenas – Academia Bukhari
El Indicador de Caza de Ballenas es una poderosa herramienta de trading diseñada específicamente para índices Boom & Crash y índices de Volatilidad. Cuenta con un Detector Automático de Tendencias, detecta tendencias alcistas y bajistas, marca puntos de estructura del mercado (HH, HL, LH, LL), y proporciona señales de compra y venta de alta precisión para ayudar a los traders a tomar decisiones informadas.
Características Clave:
✅ Detector Automático de Tendencias – Identifica automáticamente las tendencias del mercado, reduciendo la necesidad de análisis manual.
✅ Diseñado para índices Boom & Crash y de Volatilidad – Optimizado para operar en estos mercados sintéticos.
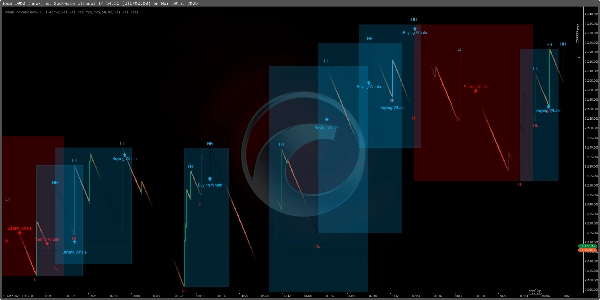
✅ Detección de Picos en Boom & Crash (Marco Temporal M1) – Identifica posibles picos en M1, ayudando a los traders a captar movimientos rápidos de precios.
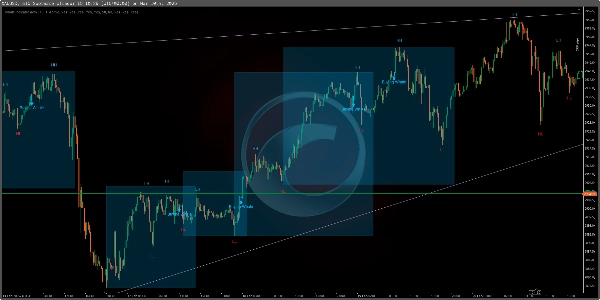
✅ Identificación de Tendencias en M15 – Funciona eficazmente en M15 para análisis de tendencias normales y configuraciones de trading estructuradas.
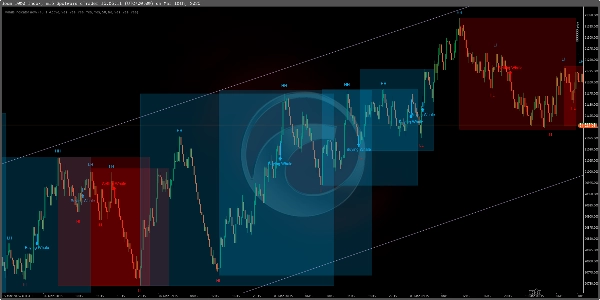
✅ Análisis de Estructura del Mercado – Muestra Máximos Más Altos (HH), Mínimos Más Altos (HL), Máximos Más Bajos (LH) y Mínimos Más Bajos (LL) para una mejor comprensión de la tendencia.
✅ Señales de Entrada de Ballenas – Resalta puntos de "Ballena Compradora" y "Ballena Vendedora" para entradas de trading precisas.
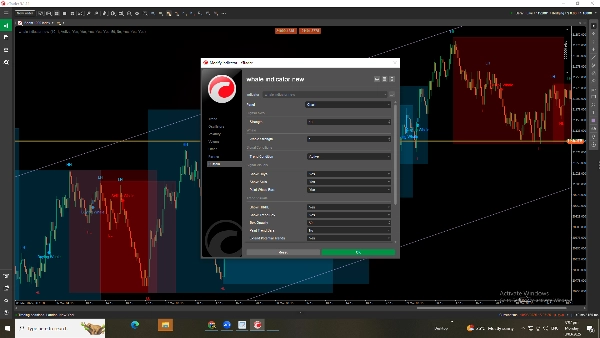
✅ Configuraciones Totalmente Personalizables – Ajusta la fuerza de la ballena, la sensibilidad de la señal y las condiciones de la tendencia para perfeccionar tu enfoque de trading.
✅ Activar/Desactivar Funciones – Alterna cajas de tendencia, puntos de estructura y señales de compra/venta según sea necesario.
¿Cómo usar el Indicador de Caza de Ballenas?
1️⃣ Detección Automática de Tendencias – Deja que el indicador identifique automáticamente la dirección de la tendencia.
2️⃣ Opera Picos de Boom & Crash en M1 – Busca señales en M1 para captar picos de precio de manera eficiente.
3️⃣ Analiza Tendencias del Mercado en M15 – Usa M15 para análisis estructurado de tendencias y confirmación de operaciones.
4️⃣ Sigue la Estructura del Mercado – Usa HH, HL, LH, LL para entender la dirección y fuerza de la tendencia.
5️⃣ Busca Señales de Ballenas – Entra en operaciones en puntos de "Ballena Compradora" o "Ballena Vendedora".
6️⃣ Personaliza para Precisión – Ajusta la fuerza de la ballena y la sensibilidad de la señal para optimizar resultados.
7️⃣ Activar/Desactivar Funciones – Modifica las condiciones de tendencia y configuraciones de estructura según tu estrategia.
Este indicador es perfecto para índices Boom & Crash y de Volatilidad, proporcionando oportunidades de trading de alta probabilidad con precisión y eficiencia. 🚀
5 | 33 % | |
4 | 67 % | |
3 | 0 % | |
2 | 0 % | |
1 | 0 % |


