Açıklama
🚀 10.000'den fazla tüccar zaten en iyi göstergelerimizi🏆 kullanıyor
👉 Tüm en iyi sistemlerimizi buradan alın:
_______________________________________________
📌 Piyasa Yapısı Göstergeleri
· ✅ AdvancedMarket Structure: Bos, Choch, SwinLevels, Order Blocks, Market Structure& Likidite Bulucu
· 🔄 Dinamik Piyasa Yapısı Dönüş Noktalarının Analizi
· 🧱 Order Block
· ⚖️ Piyasa Dengesizliği
· ⛓️ BOS & CHOCH
· 🧠 ICT Güç 3
_______________________________________________
🔚 Akıllı Çıkış Sistemleri
· 📍 Takip Eden Akıllı Algoritma
_______________________________________________
📐 ZigZag Göstergeleri
· 🔍 ZigZag Fiyat Likidite Projeksiyonu
· ➖ ZigZag
· 🎯 Zig-Zag Uç Nokta Takipçisi
_______________________________________________
🧱 Destek & Direnç Göstergeleri
· 🟩 SmartTrend Destek & Direnç Çizgileri
· 🧱 Tüm Destek ve Direnç Seviyeleri
_______________________________________________
📊 Trend & Kanal Göstergeleri
· 📊 Süpertrend
· 🧠 Uyarlanabilir Trend Kanalı
· 🔁 Reaktif Hareketli Ortalama
_______________________________________________
💧 Hacim & Likidite Araçları
· 🔍 Momentum Adil Değer Boşluğu
· 🕒 Adil Değer Boşluğu Seansları
_______________________________________________
⚡ Momentum & RSI Göstergeleri
· 🔎 Çok Katmanlı Mum Eğilimi
Takipçisi
_______________________________________________
🔮 Tahmin & Projeksiyon Araçları
· 📐 Linreg & ATR'ye Dayalı Tahmin
· 📏 Fibonacci Doğrusal Regresyon Çoklu Zaman Dilimi
· 📈 Hacim Destekli Piyasa Akışı Projeksiyonu
Otomatik Arz ve Talep: 💹
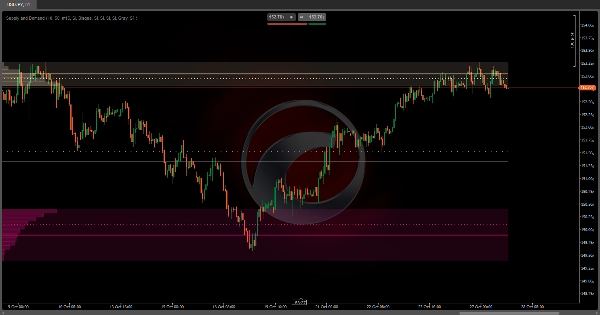
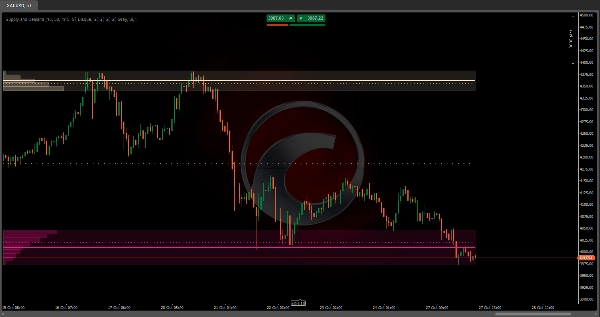
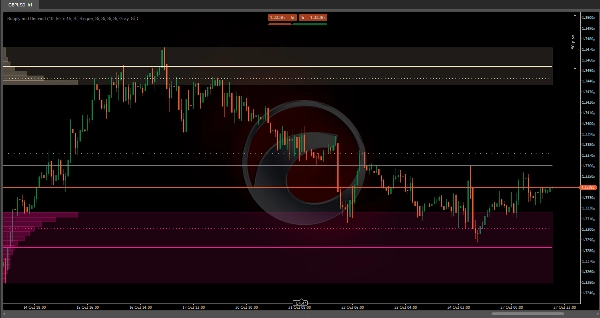
Otomatik Arz ve Talep, grafik üzerinde en yüksek işlem aktivitesine sahip bölgeleri otomatik olarak tanımlayan gelişmiş bir hacim analiz göstergesidir. 📊 Diğer statik göstergelerin aksine, bu gösterge gözlemlediğiniz görsel aralığa dinamik olarak uyum sağlar ve her zoom veya kaydırma işleminde bölgeleri yeniden hesaplar.
Nasıl çalışır? ❓
Algoritma, görünür fiyat aralığını birden fazla yatay seviyeye (2 ila 500 arası bölünebilir) böler ve her seviyede işlem gören hacmi analiz eder. Daha yüksek doğruluk için, gözlemlediğiniz zaman diliminden daha düşük bir zaman diliminden veri kullanır. 🕒 Örneğin, 1 saatlik bir grafik izliyorsanız, hacmin gerçekten nerede yoğunlaştığını daha detaylı tespit etmek için 15 dakikalık mumları analiz edebilir.
Tanımlama Süreci 🔍
Gösterge, uçlardan merkeze doğru çalışır:
- En yüksek fiyattan: 🚀 Görünür aralığın en yüksek noktasından başlar ve seviye seviye aşağı iner, her fiyat bandında işlem gören hacmi toplar.
- En düşük fiyattan: 📉 Aynı anda, en düşük noktadan yukarı doğru çıkarak hacmi toplar.
- Aktivasyon eşiği: ⚡ Bu bölgelerden herhangi biri toplam hacmin belirli bir yüzdesini (varsayılan olarak %10, ayarlanabilir) topladığında, önemli bir bölge olarak işaretlenir ve o yöndeki arama durur.
- Orta bölge: ⚖️ Hem üst hem alt bölgeler belirlendikten sonra, aradaki alan nötr veya denge bölgesi olarak işaretlenir.
Ne işe yarar? 🎯
Bu gösterge, piyasa yapısı analiz aracı olarak size yardımcı olur:
- Arz bölgelerini tanımlamak: 🏔️ Tarihsel olarak yüksek satış aktivitesinin olduğu üst bölgeler.
- Talep bölgelerini tanımlamak: 🏖️ Alım aktivitesinin yoğunlaştığı alt bölgeler.
- Denge bölgelerini tespit etmek: 🎭 Alım ve satım baskısının birbirini dengelediği orta aralık.
Bu bölgeler, gelecekte fiyat için mıknatıs görevi görme eğilimindedir, çünkü birçok katılımcının pozisyon aldığı seviyeleri temsil eder. 🧲
Nasıl kombinlenebilir? 🔗
Fiyat hareketi stratejileri ile:
- Belirlenen bölgelerin yeniden testlerini bekleyerek dönüş onayları arayın.
- Bölgeleri kar alma hedefleri veya zarar durdurma yerleşimi olarak kullanın.
Trend göstergeleri ile:
- Bir yükseliş trendinde, fiyat alt talep bölgesini yeniden test ettiğinde girişler arayın. 📈
- Bir düşüş trendinde, üst arz bölgesini satışlar için direnç olarak kullanın. 📉
Çoklu zaman dilimi analizi ile:
- Daha yüksek zaman dilimlerinde bölgeleri tanımlayın ve daha düşük zaman dilimlerinde onaylar arayın.
- Daha yüksek zaman diliminden gelen bölgeler, daha düşük zaman dilimlerinde birden fazla bölge içerebilir.
Momentum göstergeleri ile:
- Bölgelerde aşırı alım/aşırı satım koşullarını onaylamak için RSI veya Stokastik ile kombinleyin.
- Diverjanslar arz/talep bölgelerinde potansiyel dönüşleri işaret edebilir.
Özelleştirilebilir Konfigürasyon ⚙️
Gösterge, her bölgeyi tamamen bağımsız olarak ayarlamanıza olanak tanır:
- Her görsel öğeyi (alanlar, ortalama çizgiler, ağırlıklı çizgiler) etkinleştirip devre dışı bırakın.
- Hacim eşiği: Bir bölgeyi önemli saymak için toplam hacmin ne kadarının birikmesi gerektiği.
- Fiyat bölümleri: Daha yüksek sayı = daha fazla hassasiyet ama daha fazla hesaplama.
- Daha düşük zaman dilimi: Hacim analizinin detay seviyesini belirler.
Ana Özellik: Otomatik Uyarlama 🔄
Görüşünüze göre otomatik yeniden hesaplama. Bu şu anlama gelir:
- Eğer yakınlaştırırsanız bir seansın detayını görmek için, o saatlere özgü arz ve talep bölgelerini tanımlar.
- Eğer uzaklaştırırsanız haftalar veya aylar görmek için, tüm dönem için makro bölgeleri yeniden hesaplar.
- Her kaydırdığınızda grafikte, bölgeler görünür aralığın bağlamını yansıtacak şekilde güncellenir.
Özet
The indicator divides the visible price range into configurable horizontal levels (2 to 500 divisions) and analyzes volume traded at each level using data from a lower timeframe than the chart’s timeframe for enhanced accuracy. It identifies significant zones by accumulating volume from the highest and lowest visible prices until a configurable volume threshold (default 10%) is reached, marking these as supply and demand zones respectively. The area between these zones is designated as a balance zone, representing equilibrium between buying and selling pressures.
These zones highlight areas of historically high trading activity that often act as future price magnets. The indicator supports customization of visual elements, volume thresholds, price divisions, and analysis timeframe. It can be combined with price action strategies, trend indicators, multiple timeframe analysis, and momentum indicators like RSI or Stochastic to improve trade entries, exits, and confirmations.
Supported markets include Forex, Indices, Commodities, Stocks, and Cryptocurrencies, with symbols such as EURUSD, GBPUSD, BTCUSD, XAUUSD, and NAS100.
Müşteri değerlendirmeleri
5 | 50 % | |
4 | 0 % | |
3 | 0 % | |
2 | 0 % | |
1 | 50 % |