Penerangan
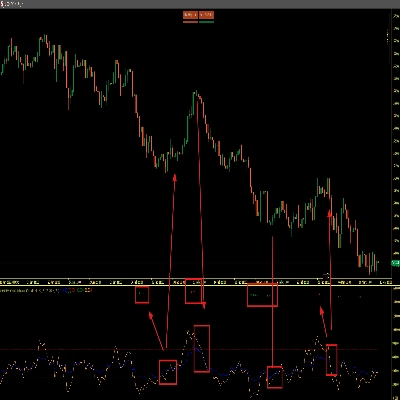
Penunjuk cTrader ini mengenal pasti dan memvisualisasikan pertama ketidakseimbangan pasaran tertentu yang berlaku semasa tiga sesi dagangan utama New York. Ia direka untuk pengamal ICT (Inner Circle Trader) yang memfokuskan pada susunan "pertama yang dipersembahkan" sebagai jejak institusi berkemungkinan tinggi.
Fungsi Teras (Core)
Penunjuk memantau pasaran bermula pada pembukaan setiap sesi dan "mengunci" ketidakseimbangan pertama yang ditemuinya. Setelah satu jenis ketidakseimbangan (seperti FVG) dilukis untuk sesi tertentu, ia tidak akan melukis jenis yang sama sehingga sesi berikutnya bermula.
1. Jenis Ketidakseimbangan yang Dikesan
- Jurang Nilai Adil (FVG): Struktur tiga lilin di mana sumbu lilin pertama dan sumbu lilin ketiga tidak bertindih, meninggalkan "jurang" pada julat harga lilin kedua.
- Ketidakseimbangan Isipadu (VI): Berlaku apabila terdapat jurang antara badan (Buka/Tutup) dua lilin berturut-turut, walaupun sumbu bertindih.
- Kekosongan Likuiditi (LV): Jurang yang lebih ekstrem di mana tiada tindakan harga langsung antara sumbu dua lilin berturut-turut (lonjakan harga sepenuhnya).
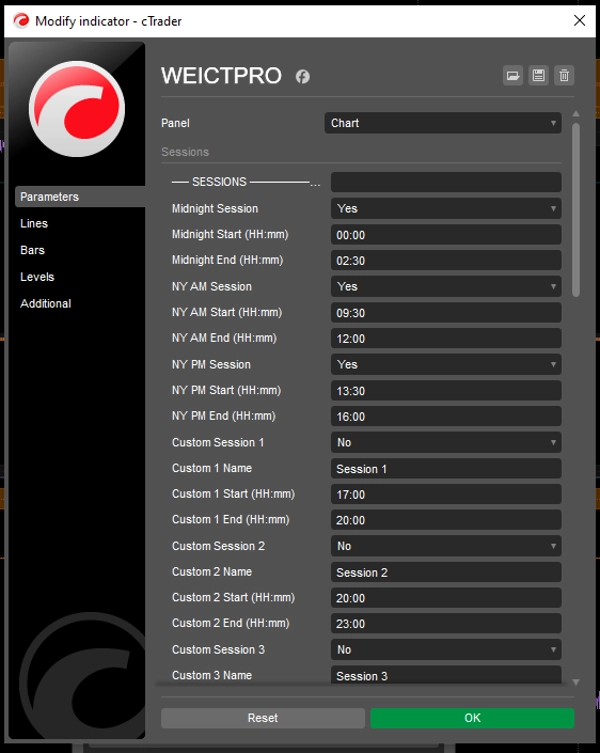
2. Sesi yang Dipantau (Waktu New York)
Penunjuk secara automatik menukar masa carta anda ke Waktu Timur (ET) untuk menjejaki:
- Tengah Malam: 00:00 – 02:30
- NY AM: 09:30 – 12:00
- NY PM: 13:30 – 16:00
Ciri Visual
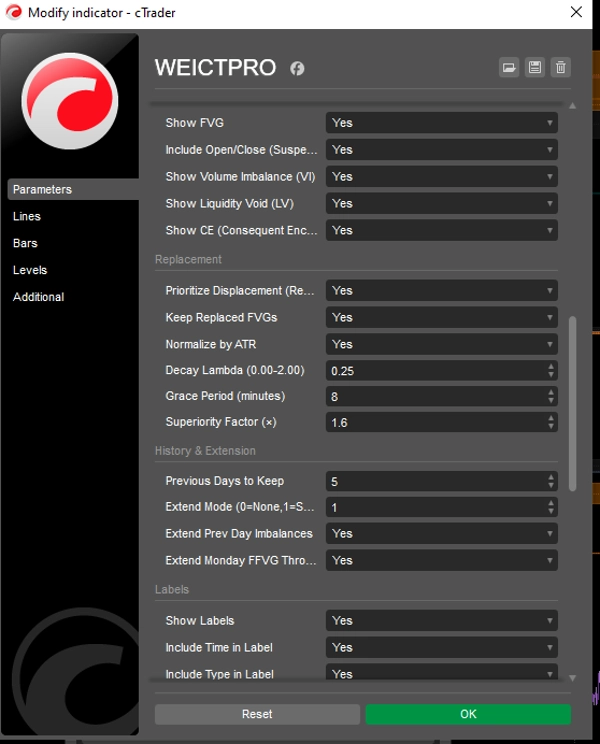
- Sambungan Dinamik: Kotak dilukis dari titik asal dan secara automatik melanjutkan ke hadapan mengikut bilangan bar yang ditetapkan pengguna (
Extend Bars) untuk menunjukkan sokongan/rintangan masa depan yang berpotensi. - Pencerobohan Bersiri (CE): Melukis garis putus-putus di tengah ketidakseimbangan. Dalam teori ICT, tahap 50% (CE) adalah titik rujukan institusi yang kritikal.
- Pelabelan Automatik: Menandakan setiap kotak dengan jelas menggunakan nama sesi dan jenis ketidakseimbangan (contohnya, "NY AM +FVG").
Parameter Utama
Parameter
Penerangan
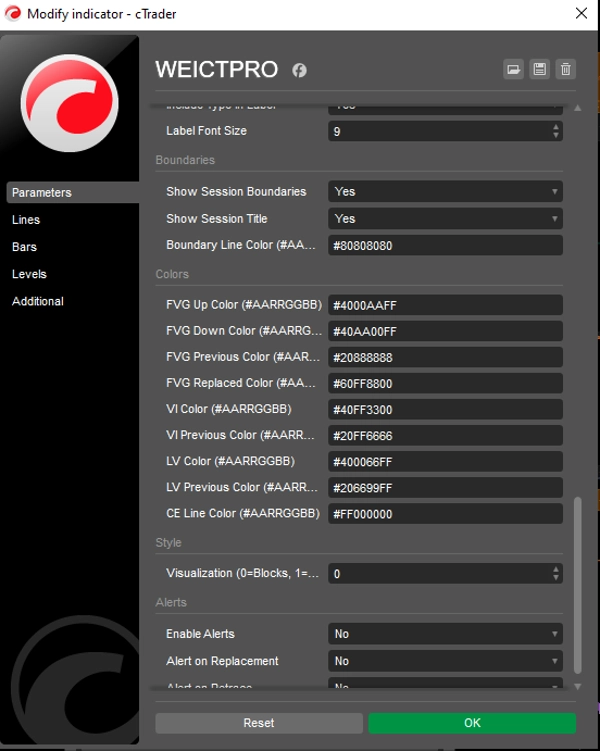
Tunjukkan FVG/VI/LV
Togol jenis ketidakseimbangan tertentu yang anda ingin jejak.
Ketelusan Kotak
Melaraskan betapa "pekat" kawasan yang diwarnakan pada carta anda.
Extend Bars
Berapa banyak lilin ke masa depan kotak harus diproyeksikan.
Zon Waktu
Ditetapkan secara keras kepada Waktu Piawai Timur untuk memastikan ketepatan sesi tanpa mengira masa pelayan broker anda.
Cadangan Teknikal
- Jangka Masa: Terbaik digunakan pada M1 hingga M15. Pada jangka masa lebih tinggi (H1+), sesi terlalu singkat untuk menangkap ketidakseimbangan "pertama" dengan boleh dipercayai.
- Penggunaan: Kawasan ini sering bertindak sebagai "magnet" untuk harga. Pedagang mencari harga untuk kembali ke kotak ini (terutamanya tahap CE) untuk kemasukan sebelum meneruskan arah asal.
Ringkasan
The indicator detects three imbalance types: Fair Value Gap (FVG), a three-candle gap where the first and third candle wicks do not overlap; Volume Imbalance (VI), a gap between the bodies of two consecutive candles; and Liquidity Void (LV), a total price jump with no price action between consecutive candle wicks. Once an imbalance type is identified in a session, it locks and does not redraw until the next session.
Visual features include dynamically extending boxes from the imbalance origin for a user-defined number of bars, a dashed midline marking the 50% level (Consequent Encroachment), and automated labeling with session and imbalance type. The indicator is hardcoded to Eastern Time for session accuracy and is best used on M1 to M15 timeframes to reliably capture the first imbalance. Users can toggle imbalance types, adjust box opacity, and set extension length. This tool supports multiple markets including Forex, indices, commodities, stocks, and cryptocurrencies.