
Penerangan
Kotak S/R Isipadu Tinggi WeTrades
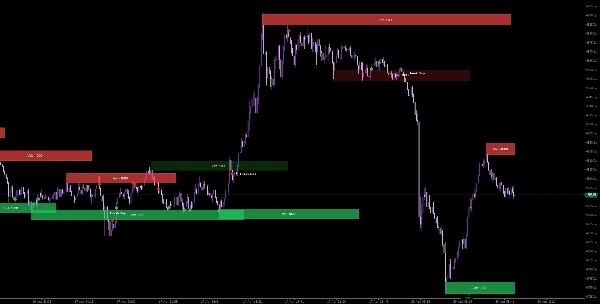
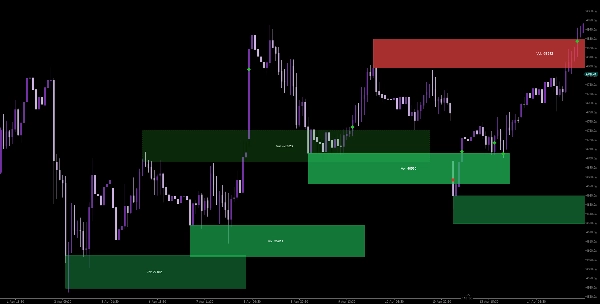
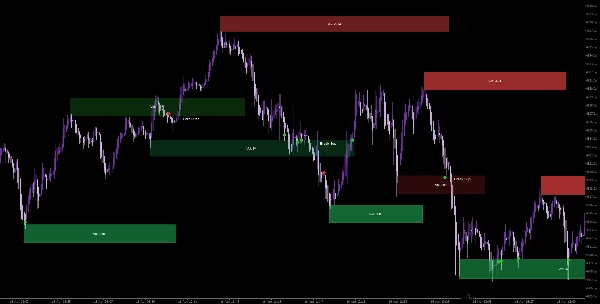
Kotak S/R Isipadu Tinggi WeTrades adalah penunjuk sokongan dan rintangan maju yang menyerlahkan zon harga utama berdasarkan aktiviti isipadu tinggi dan struktur pasaran.
Daripada garis tradisional, alat ini memvisualisasikan zon sokongan dan rintangan dinamik sebagai kotak, memberikan anda pemahaman yang lebih jelas tentang di mana tekanan pembelian dan penjualan yang kuat wujud.
Dibina berdasarkan logik berasaskan isipadu yang diilhamkan oleh konsep ChartPrime, penunjuk ini membantu pedagang mengenal pasti zon reaksi berkemungkinan tinggi, pecahan, dan peralihan kecairan dengan ketepatan.
Ciri Utama
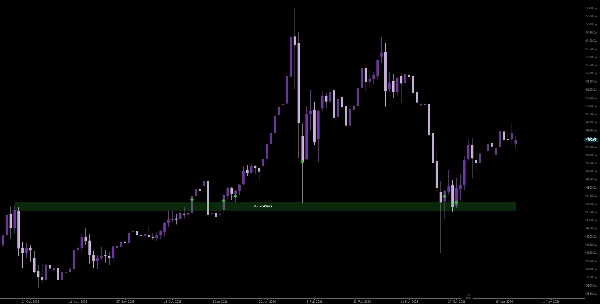
Zon S/R Berasaskan Isipadu Tinggi
Secara automatik mengesan sokongan dan rintangan menggunakan penutupan pivot digabungkan dengan kekuatan isipadu.
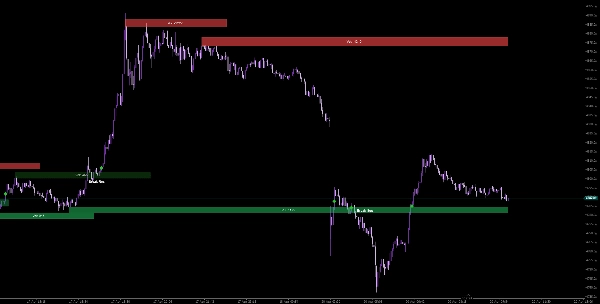
Visualisasi Kotak Dinamik
Memaparkan zon sebagai kotak adaptif yang berkembang dengan harga, menjadikan struktur lebih mudah dibaca berbanding garis statik.
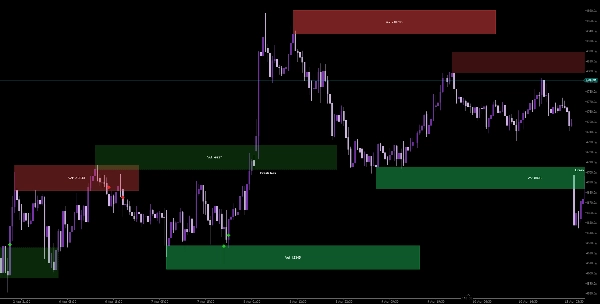
Lebar Zon Berasaskan ATR
Melaraskan saiz kotak berdasarkan volatiliti pasaran untuk tahap yang lebih realistik dan responsif.
Label Kekuatan Isipadu
Setiap zon termasuk label isipadu, membantu anda mengenal pasti dengan cepat tahap yang kuat berbanding lemah.
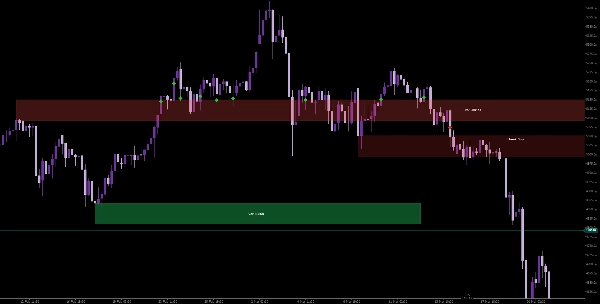
Isyarat Pecah & Pegang
- Mengesan apabila sokongan/rintangan bertahan
- Menyorot peristiwa pecahan
- Mengesan pembalikan peranan (sokongan ↔ rintangan bertukar)
Penapisan Isipadu Pintar
Menapis zon lemah menggunakan tetingkap isipadu delta untuk menumpukan hanya pada aktiviti bermakna.
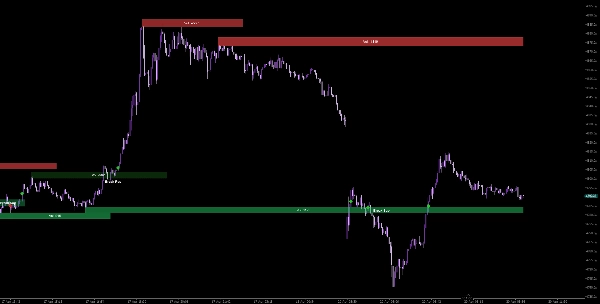
Bagaimana Ia Membantu Anda Berdagang
- Kenal pasti zon pengumpulan dan pengedaran yang kuat
- Kenal pasti kawasan pembalikan berkemungkinan tinggi
- Berdagang pecahan dengan pengesahan isipadu
- Fahami peralihan struktur pasaran dengan jelas
- Tingkatkan masa masuk dan keyakinan
Kes Penggunaan Terbaik
- Konsep Wang Pintar (SMC)
- Perdagangan Bekalan & Permintaan
- Strategi pecahan dan ujian semula
- Sistem perdagangan berasaskan isipadu
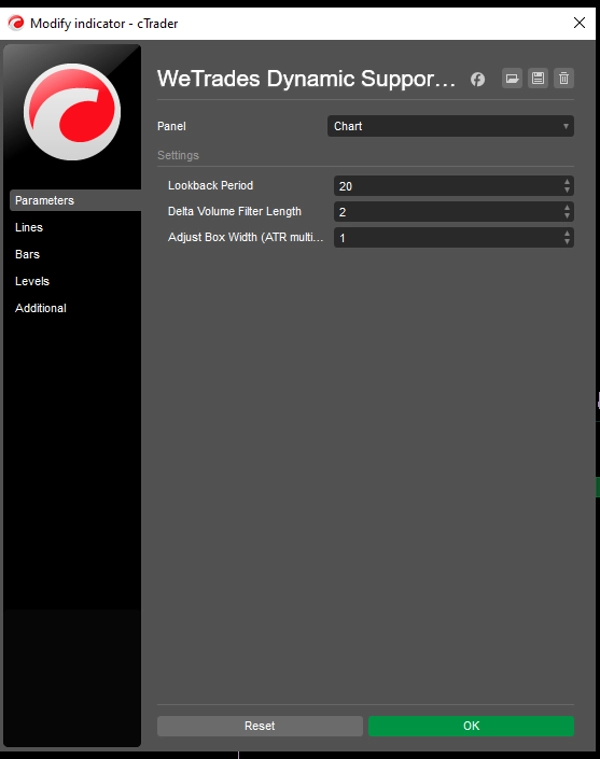
Parameter
- Tempoh Lookback – Mengawal kepekaan pivot
- Panjang Penapis Isipadu Delta – Menapis zon lemah
- Lebar Kotak (Pengganda ATR) – Melaraskan saiz zon


![Logo "[Hamster-Coder] Bollinger Bands"](https://cdn.ctrader.com/image/webp/21d8e5d6-fb11-4bac-b9ee-cd05c2b76804_30327)