Penerangan
Jika anda berdagang tindakan harga, anda sudah tahu bahawa tahap yang paling
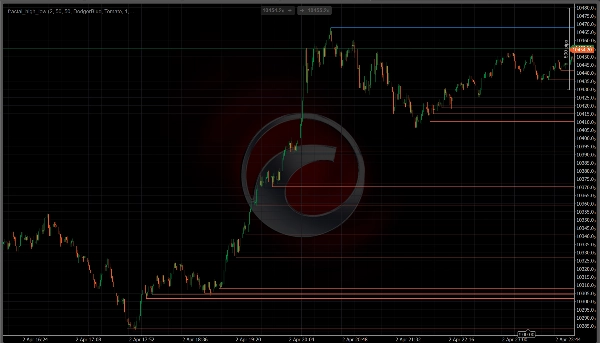
penting pada mana-mana carta adalah tinggi dan rendah fraktal —
titik ayunan di mana harga menolak, berbalik, atau memecahkan
struktur. Garis Tinggi Rendah Fraktal mencari titik-titik itu untuk anda
dan melukisnya secara automatik, supaya anda boleh memberi tumpuan sepenuhnya kepada
membaca harga daripada menguruskan lukisan.
──────────────────────────────────────────────────────────
CARA IA BERFUNGSI
──────────────────────────────────────────────────────────
Penunjuk menggunakan logik fraktal klasik Williams untuk mengesahkan
titik pivot. Tinggi fraktal hanya sah apabila tinggi itu
lebih tinggi secara ketat daripada bar di sekeliling pada kedua-dua sisi. Rendah fraktal hanya sah apabila rendahnya
lebih rendah secara ketat.
Setelah disahkan, satu garis mendatar dilukis dari pivot itu
dan dilanjutkan ke hadapan — memberikan anda rujukan visual yang jelas
untuk setiap tahap struktur penting pada carta.
Tiada lukisan semula. Fraktal hanya disahkan selepas cukup bar
telah ditutup di kedua-dua sisi, jadi tahap tidak pernah muncul dan
hilang apabila harga bergerak.
──────────────────────────────────────────────────────────
CIRI UTAMA
──────────────────────────────────────────────────────────
• Pengesanan fraktal automatik — mengimbas semua bar semasa muat, kemudian
mengemas kini secara masa nyata apabila bar baru terbentuk
• Tempoh fraktal boleh dikonfigurasikan — gunakan tempoh 2 untuk setiap
ayunan kecil, atau tingkatkan untuk mengasingkan hanya tinggi dan rendah
struktur utama
• Kawalan garis maksimum — hadkan secara bebas berapa banyak
garis rintangan dan sokongan yang dipaparkan sekaligus, memastikan
carta anda bersih dan fokus pada struktur terkini
• Penghapusan tahap pecah — secara pilihan menghapuskan garis
apabila harga menutup melaluinya, supaya hanya tahap yang tidak pecah
kekal kelihatan
• Kawalan visual penuh — tetapkan warna, ketebalan, dan gaya
garis (Solid, Dash, Dot) secara bebas untuk tinggi dan
rendah
• Ringan — setiap garis dilukis sekali dan tidak pernah dilukis semula,
jadi prestasi kekal lancar walaupun pada carta M1 atau M5
──────────────────────────────────────────────────────────
SIAPA IA UNTUK
──────────────────────────────────────────────────────────
Dibina khusus untuk pedagang tindakan harga yang menggunakan tinggi dan rendah ayunan
untuk mengenal pasti struktur, merancang kemasukan dagangan,
menetapkan henti rugi, dan mengesan zon potensi pembalikan atau pecahan
Berfungsi pada mana-mana simbol dan mana-mana jangka masa dalam cTrader.
──────────────────────────────────────────────────────────
PERCUMA — TIADA SYARAT TERSEMBUNYI
──────────────────────────────────────────────────────────
Garis Tinggi Rendah Fraktal adalah sepenuhnya percuma. Pasang, tambah ke
carta anda, dan berdagang dengan tahap struktur yang lebih bersih dari
sesi pertama anda.
==========================================================
Ringkasan
The indicator updates in real time as new bars form and scans all bars on load. It offers configurable fractal periods to capture minor or major swings, controls to limit the number of displayed lines for clarity, and an option to automatically remove lines when price closes through them. Users can customize line color, thickness, and style independently for highs and lows. The indicator is lightweight, drawing each line once to maintain smooth performance even on low timeframes like M1 or M5.
fractal_high_low works on any symbol and timeframe within the cTrader platform and supports markets including Forex, stocks, commodities, indices, and cryptocurrencies. It aids traders in identifying market structure, planning entries, setting stops, and spotting reversal or breakout zones.


![Logo "Gaussian Channel [Iridio Capital]"](https://cdn.ctrader.com/image/webp/7c039209-5573-4a54-a072-f9528b503103_41960)


