설명
스윙 감지기
구조적 스윙 포인트 + 피보나치 되돌림 + RSI
--------------------------------------------------
무료 지표
구조적 스윙을 식별하세요. 추세를 확인하세요. 합류점과 함께 거래하세요.
--------------------------------------------------
이 지표가 하는 일
스윙 감지기는 구성 가능한 깊이와 자동 편차 필터링을 사용하는 국부 극값 감지를 통해 구조적 스윙 고점과 저점을 식별합니다.
그런 다음 스윙을 추세선으로 연결하고, 표준 피보나치 되돌림 수준을 오버레이하며, 가격 근처에 현재 RSI 값을 표시합니다.
--------------------------------------------------
주요 특징
- 스윙 포인트 감지 (구성 가능한 깊이)
- 자동 편차: ATR 기반 필터링으로 모든 타임프레임에 적응
- 고정 핍 편차 모드 (수동 제어용)
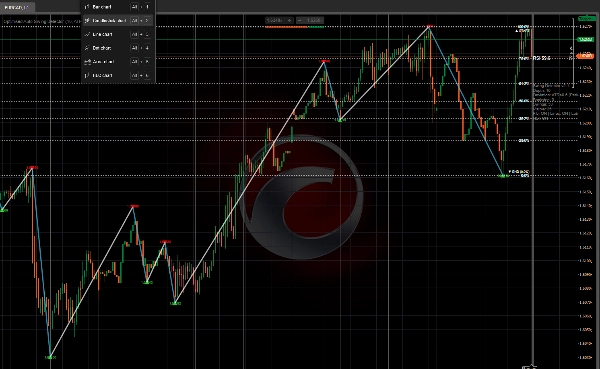
- 스윙 추세선 (상승 스윙 파란색, 하락 스윙 주황색)
- 피보나치 되돌림 (0, 23.6, 38.2, 50, 61.8, 78.6, 100 퍼센트)
- RSI 값 오버레이 (가격 근처 현재 RSI)
- 사용자 지정 가능한 색상
- 성능 최적화 (최대 표시 바 수)
--------------------------------------------------
자동 편차 - 주요 특징
두 가지 편차 모드가 있습니다:
- 고정 핍: 스윙 간 최소 핍 거리를 고정 설정
- ATR 기반 (자동): 현재 변동성에 따른 동적 편차
자동 편차가 중요한 이유:
- M1부터 M5까지: 좁은 편차 (작은 스윙 포착)
- H1부터 H4까지: 중간 편차 (구조 포착)
- D1부터 MN1까지: 넓은 편차 (주요 스윙 포착)
이 지표는 사용 중인 타임프레임에 자동으로 적응합니다. 차트를 전환할 때 수동 조정이 필요 없습니다.
이로 인해 스윙 감지기는 1분 차트부터 월간 차트까지 모든 타임프레임에서 사용할 수 있습니다.
--------------------------------------------------
피보나치 되돌림 - 주요 특징
마지막 완료된 스윙에 대해 지표는 다음을 그립니다:
- 0.0 퍼센트 (스윙 시작점)
- 23.6 퍼센트
- 38.2 퍼센트
- 50.0 퍼센트
- 61.8 퍼센트
- 78.6 퍼센트
- 100.0 퍼센트 (스윙 종료점)
선과 레이블을 켜고 끌 수 있습니다. 모든 수준은 빠른 시각적 참조를 위해 색상 코드화되어 있습니다.
--------------------------------------------------
RSI 오버레이 - 주요 특징
현재 RSI 값이 색상 코드와 함께 가격 근처에 표시됩니다:
- 빨강: RSI 70 이상 (과매수)
- 초록: RSI 30 이하 (과매도)
- 흰색: RSI 30과 70 사이 (중립)
별도의 RSI 창을 열지 않고도 즉각적인 모멘텀 컨텍스트를 제공합니다.
--------------------------------------------------
시각적 요소
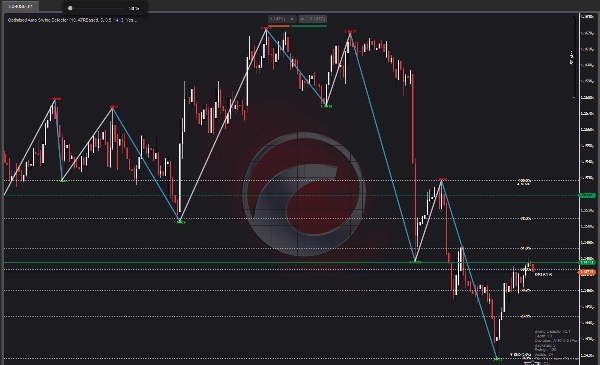
- 빨간색 아래쪽 화살표 = 스윙 고점
- 초록색 위쪽 화살표 = 스윙 저점
- 파란색 선 = 상승 스윙 (저점에서 고점으로)
- 주황색 선 = 하락 스윙 (고점에서 저점으로)
- 금색 수평선 = 피보나치 수준
- 흰색 레이블 = 피보나치 백분율
- RSI 값 = 가격 근처 현재 RSI
- 정보 패널 = 깊이, 편차, 백스텝, 스윙 수
--------------------------------------------------
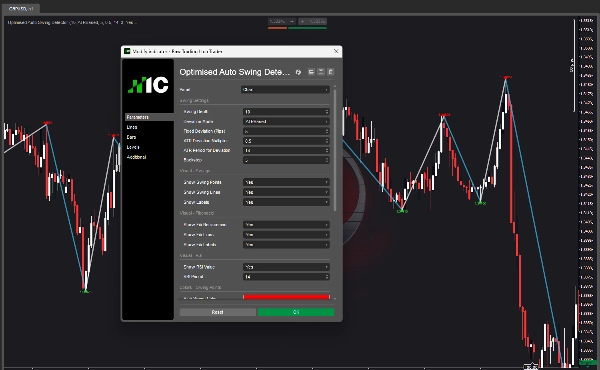
매개변수 개요
스윙 설정:
- 스윙 깊이: 국부 극값을 확인할 바 수
- 편차 모드: 고정 핍 또는 ATR 기반 (자동)
- 고정 편차: 스윙 간 최소 핍 거리
- ATR 편차 배수: ATR 기반 편차에 대한 배수
- ATR 기간: ATR 계산 기간
- 백스텝: 스윙 간 최소 바 수
시각적 - 스윙:
- 스윙 포인트 표시: 화살표 토글
- 스윙 라인 표시: 추세선 토글
- 레이블 표시: 가격 레이블 토글
시각적 - 피보나치:
- 피보나치 되돌림 표시: 피보나치 오버레이 토글
- 피보나치 라인 표시: 수평선 토글
- 피보나치 레이블 표시: 백분율 레이블 토글
시각적 - RSI:
- RSI 값 표시: RSI 오버레이 토글
- RSI 기간: RSI 계산 기간
색상:
- 고점 스윙 색상
- 저점 스윙 색상
- 상승 스윙 라인 색상
- 하락 스윙 라인 색상
- 피보나치 라인 색상
- 피보나치 텍스트 색상
- RSI 레이블 색상
성능:
- 최대 표시 바 수: 더 빠른 성능을 위한 그리기 제한
--------------------------------------------------
사용 사례
- 모든 타임프레임에서 구조적 스윙 포인트 식별
- 스윙 간 추세선 그리기
- 진입, 청산 및 이익 목표에 피보나치 수준 사용
- RSI 합류로 거래 확인
- 한눈에 시장 구조 이해
- 매개변수 조정 없이 타임프레임 전환 (자동 편차)
--------------------------------------------------
타임프레임 사용성
자동 편차가 활성화된 상태에서 이 지표는 다음 타임프레임에서 작동합니다:
- M1, M5, M15 (스캘핑)
- M30, H1, H4 (데이 트레이딩)
- D1 (스윙 트레이딩)
- W1, MN1 (포지션 트레이딩)
하나의 지표. 모든 타임프레임.
--------------------------------------------------
구조적 히트 존으로 업그레이드
이 무료 지표는 스윙과 구조를 보여줍니다.
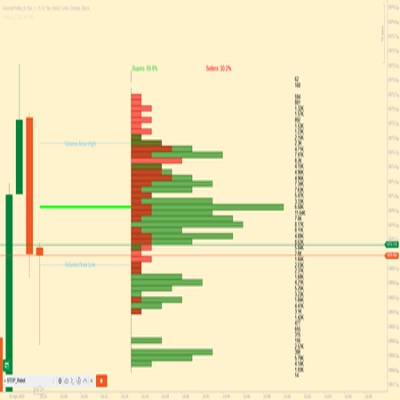
구조적 히트 존은 한 단계 더 나아가 참여 강도, 수용 대 거부, 그리고 여러 존에 걸친 시장 참여를 매핑합니다.
cTrader 스토어에서 구조적 히트 존을 검색하세요.
--------------------------------------------------
인빅터스 EA로 업그레이드
인빅터스 EA는 동일한 구조 기술을 사용하여 자동화된 거래를 실행합니다.
cTrader 스토어에서 인빅터스를 검색하세요.
--------------------------------------------------
기술 노트
- 오버레이 지표
- 모든 타임프레임과 심볼에서 작동
- 리페인트 없음 (스윙은 과거 데이터임)
- 성능 최적화
--------------------------------------------------
지원
평생 업데이트 포함.
자세한 정보는 아래 개발자 프로필을 클릭하세요.
요약
고객 리뷰
5 | 100 % | |
4 | 0 % | |
3 | 0 % | |
2 | 0 % | |
1 | 0 % |