
설명
구조적 열 구역
참여 강도 지도
--------------------------------------------------
가격이 싸우는 곳을 보세요. 무시하는 곳을 보세요.
대부분의 지지/저항 도구는 가격이 있었던 위치에 선을 그립니다.
구조적 열 구역은 묻습니다: 시장이 실제로 이 수준에 관심이 있나요?
--------------------------------------------------
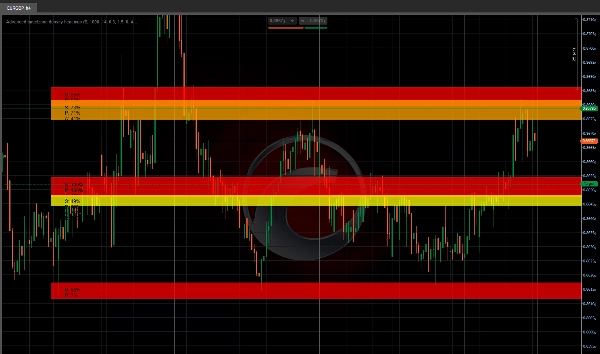
열 강도 점수 (0에서 100)
이 지표는 스윙 클러스터링을 분석하고 열 점수를 할당합니다:
- 빨간 구역 (80에서 100 열) = 가장 강한 구조적 참여
- 주황 구역 (60에서 80 열) = 활성 구조 구역
- 노란 구역 (40에서 60 열) = 중간 관심
- 파란 구역 (40 열 미만) = 약한 구조
높은 열 = 더 많은 스윙 클러스터 = 더 많은 시장 관심.
--------------------------------------------------
수용 대 거부 추적
각 구조적 열 구역에 대해, 지표는 가격 행동을 추적합니다:
- 수용 = 가격이 구역 내에서 마감 (지지 행동)
- 거부 = 가격이 구역에서 긴 꼬리를 남김 (저항 행동)
이것은 구역이 유지될지 반전될지 알려줍니다.
--------------------------------------------------
시장 참여 분석
시스템은 다음을 측정합니다:
- 캔들 접촉 (가격이 각 구역을 방문하는 빈도)
- 구역 내 마감 (수용률)
- 꼬리 거부 (거부율)
- 구성 가능한 조회 기간
낮은 참여 = 약한 구역. 높은 참여 = 구조적 열 구역.
--------------------------------------------------
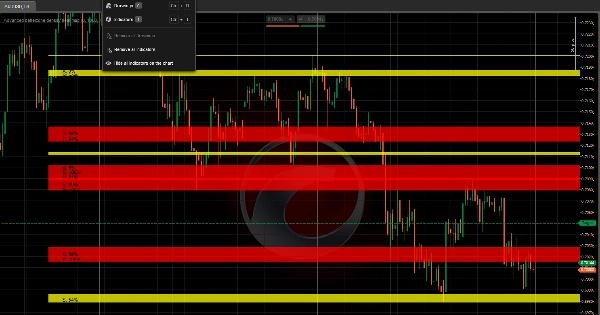
시각적 강도 매핑
- 열 점수별 색상 구역 (빨강 = 가장 뜨거움)
- 거부 시각화를 위한 후광 확장
- 데이터 라벨 표시: 열 / 참여 / 수용 / 거부 점수
- 자동 정리 (구역 자동 재그리기)
- 선택적 스윙 고점/저점 화살표
--------------------------------------------------
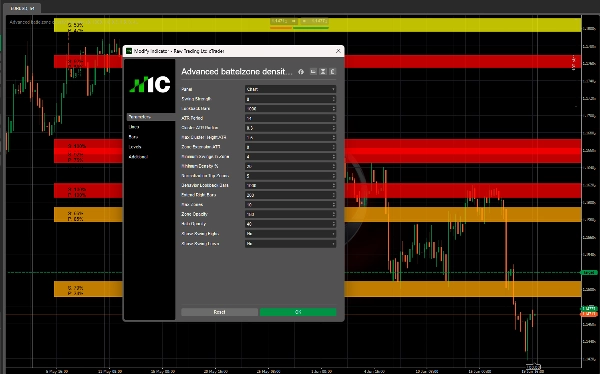
주요 매개변수
- 스윙 강도: 피벗 민감도 (높을수록 스윙 적음)
- 조회 바: 스윙 감지 기간
- ATR 기간: 적응 반경 계산용
- 클러스터 ATR 반경: 스윙이 클러스터링 되기 위한 거리
- 최대 클러스터 높이 ATR: 이보다 넓은 구역은 거부
- 구역 확장 ATR: 거부 감지를 위한 후광 크기
- 구역 내 최소 스윙: 최소 클러스터 크기
- 최소 열 점수: 이 이상인 구역만 표시
- 행동 조회 바: 참여 추적 기간
- 최대 구역 수: 표시할 최대 구역 수
- 구역 / 후광 불투명도: 시각적 투명도
--------------------------------------------------
사용 사례
- 진정한 구조적 열 구역 찾기 (높은 열 + 높은 참여)
- 수용 구역과 거부 구역 구분
- 낮은 열, 낮은 참여 구역 피하기
- 진입 및 청산 위치를 위한 구조적 클러스터 식별
- 추세 지표 또는 주문 흐름과의 합류
--------------------------------------------------
기술 노트
- 오버레이 지표 (가격 차트에 그려짐)
- 모든 시간대 및 심볼에서 작동
- ATR을 통한 변동성 자동 적응
- 리페인트 없음 (스윙은 과거 데이터)
--------------------------------------------------
INVICTUS EA 제작자 제공
구조적 열 구역은 Invictus 자동 거래 시스템에서 사용되는 동일한 구조적 참여 기술을 공유합니다.
--------------------------------------------------
위험 고지
이 지표는 분석 도구입니다. 자동 거래 신호를 생성하지 않습니다. 모든 거래 결정은 사용자 책임입니다.
--------------------------------------------------
지원
평생 업데이트 포함.
자세한 정보는 아래 개발자 프로필을 클릭하세요.
요약
Key features include color-coded heat zones, halo extensions for rejection visualization, and data labels displaying heat, participation, acceptance, and rejection scores. The system measures candle touches, closes inside zones, and wick rejections over a configurable lookback period to quantify market engagement. Adjustable parameters allow customization of swing sensitivity, cluster radius, zone size, and visual opacity.
This tool supports any timeframe and symbol, adapts to volatility using ATR, and does not repaint historical swings. It is intended for identifying genuine structural heat zones, differentiating acceptance from rejection areas, and aiding entry and exit placement in conjunction with other trend or order flow indicators. The indicator is analytical and does not generate automated trading signals.
고객 리뷰
5 | 100 % | |
4 | 0 % | |
3 | 0 % | |
2 | 0 % | |
1 | 0 % |


