Mô tả
BỘ QUÉT VÙNG HỢP NHẤT GIÁ TRỊ CAO
Phát hiện hợp nhất thông minh với trực quan bản đồ nhiệt
--------------------------------------------------
Tìm các vùng hợp nhất có xác suất cao. Xem nơi giá thực sự giao dịch.
--------------------------------------------------
ĐIỀU MÀ CHỈ BÁO NÀY LÀM
Hầu hết các bộ quét hợp nhất chỉ đơn giản vẽ các hộp quanh phạm vi giá. Chỉ báo này đi xa hơn bằng cách phân tích chất lượng của mỗi lần chạm — phân biệt giữa chạm thân nến trong vùng (tham gia mạnh) và chỉ chạm bấc (tham gia yếu).
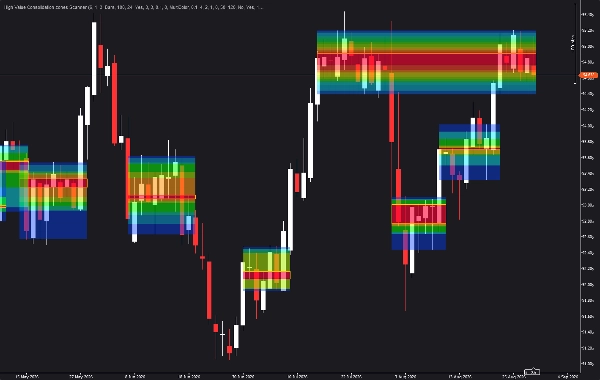
Kết quả là một bản đồ nhiệt cho bạn thấy chính xác nơi giá đã dành nhiều thời gian nhất trong mỗi vùng, giúp bạn xác định các mức độ tin cậy nhất để vào lệnh, thoát lệnh và đặt điểm dừng.
--------------------------------------------------
LOGIC CỐT LÕI VÀ TÍNH TOÁN
Chỉ báo quét hành động giá gần đây để tìm các phạm vi nến chồng lấn. Khi một số lượng nến đủ lớn chồng lấn liên tục, một vùng hợp nhất được phát hiện. Số nến liên tiếp tối thiểu cần thiết có thể cấu hình, cũng như số nến không đồng thuận tối đa được phép trong chuỗi.
Đối với mỗi vùng, chỉ báo theo dõi có bao nhiêu nến có thân nằm trong vùng so với bao nhiêu nến chỉ chạm vùng bằng bấc. Nến thân trong vùng biểu thị sự tham gia mạnh, trong khi nến chỉ bấc biểu thị sự quan tâm yếu hơn. Sự phân biệt này tạo thành cơ sở của điểm sức mạnh.
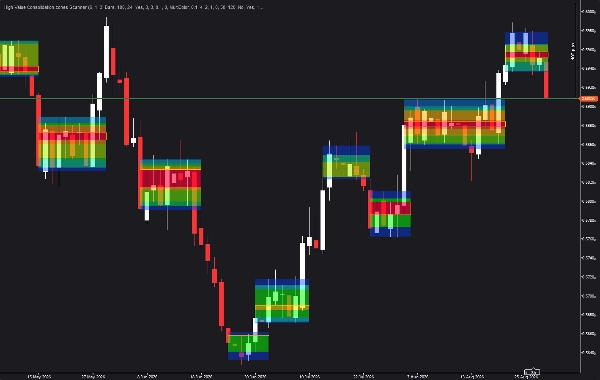
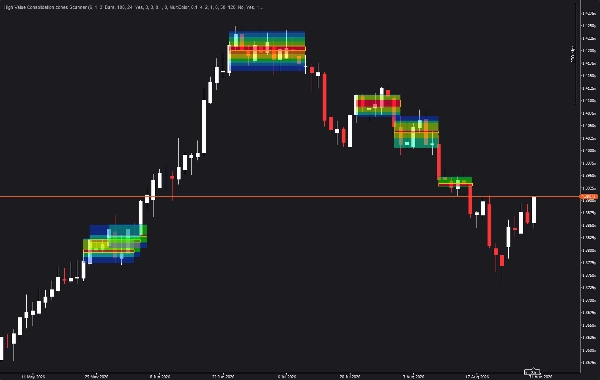
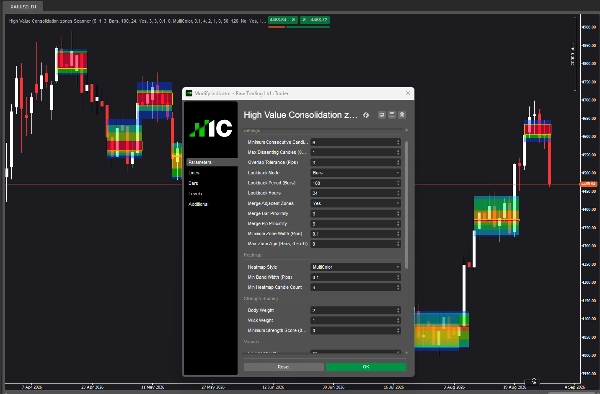
Một bản đồ nhiệt động được xây dựng bằng cách phân tích phân bố hoạt động nến trong mỗi vùng. Các mức giá có hoạt động cao hơn được hiển thị bằng màu ấm hơn (đỏ/cam), trong khi các mức hoạt động thấp hơn được hiển thị bằng màu lạnh hơn (xanh dương). Điều này cung cấp một hình ảnh trực quan ngay lập tức về nơi giá thực sự đã giao dịch.
Nhiều vùng có thể được hợp nhất nếu chúng chồng lấn về giá và gần nhau về thời gian, giảm bớt sự lộn xộn trên biểu đồ và tạo ra các vùng rộng hơn, có ý nghĩa hơn.
--------------------------------------------------
TÍNH NĂNG CHÍNH
- PHÁT HIỆN HỢP NHẤT TỰ ĐỘNG: Xác định các vùng nơi các nến liên tục chồng lấn, với số nến liên tiếp tối thiểu và độ dung sai không đồng thuận có thể cấu hình.
- TRỰC QUAN BẢN ĐỒ NHIỆT: Hiển thị mật độ hoạt động trong mỗi vùng, với màu ấm hơn biểu thị hoạt động nến cao hơn.
- ĐIỂM SỐ THÂN VÀ BẤC: Phân biệt các lần chạm mạnh (thân trong vùng) với các lần chạm yếu (chỉ bấc), cung cấp điểm sức mạnh cho mỗi vùng.
- LOGIC HỢP NHẤT: Các vùng liền kề chồng lấn về giá và gần nhau về thời gian được hợp nhất thành các vùng rộng hơn, có ý nghĩa hơn.
- CẢNH BÁO VÙNG NHẬP LẠI: Cảnh báo tùy chọn khi giá nhập lại một vùng đã phát hiện trước đó, với thời gian chờ có thể cấu hình.
- PHAI MỜ THEO TUỔI: Các vùng dần mờ đi theo thời gian, giữ trọng tâm vào các khu vực gần đây và có liên quan.
- CHẾ ĐỘ QUAY LẠI CÓ THỂ CẤU HÌNH: Chọn giữa khoảng thời gian dựa trên thanh hoặc giờ.
- LỌC SỨC MẠNH: Lọc các vùng yếu dựa trên điểm sức mạnh tối thiểu.
- HÌNH ẢNH TÙY CHỈNH: Màu vùng, độ mờ của lớp phủ, độ dày viền, vị trí nhãn và mở rộng thanh bên phải.
--------------------------------------------------
HƯỚNG DẪN THAM SỐ
CÀI ĐẶT
Số Nến Liên Tiếp Tối Thiểu: Số nến tối thiểu phải chồng lấn liên tục để tạo thành một vùng. Giá trị cao hơn tạo ra các vùng lớn hơn, quan trọng hơn. Giá trị thấp hơn tạo ra các vùng nhỏ hơn. Mặc định là 6.
Số Nến Không Đồng Thuận Tối Đa: Số nến không chồng lấn tối đa được phép trong chuỗi. Giá trị 0 yêu cầu chồng lấn liên tiếp hoàn hảo. Giá trị cao hơn cho phép một số khoảng trống. Mặc định là 1.
Độ Dung Sai Chồng Lấn (Pips): Độ dung sai tính bằng pips để xem một nến có chồng lấn vùng hay không. Mặc định là 3.0. Tăng giá trị này để có vùng rộng hơn trên các cặp biến động. Giảm để có vùng chặt hơn.
Chế Độ Quay Lại: Chọn giữa Thanh và Giờ cho khoảng thời gian quay lại. Chế độ Thanh sử dụng số nến cố định. Chế độ Giờ tính số nến dựa trên khung thời gian biểu đồ.
Khoảng Thời Gian Quay Lại (Thanh): Số thanh để quét các vùng. Mặc định là 100. Tăng để có vùng dài hạn hơn trên khung thời gian cao hơn. Giảm để tập trung vào hoạt động gần đây trên khung thời gian thấp hơn.
Số Giờ Quay Lại: Số giờ để quét các vùng. Mặc định là 24. Sử dụng với chế độ Giờ.
Hợp Nhất Các Vùng Liền Kề: Khi bật, các vùng chồng lấn về giá và gần nhau về thời gian sẽ được hợp nhất. Mặc định là true.
Khoảng Cách Thanh Hợp Nhất: Số thanh tối đa giữa các vùng để xem xét hợp nhất. Mặc định là 3.
Khoảng Cách Pip Hợp Nhất: Khoảng cách giá tối đa tính bằng pips để xem xét hợp nhất các vùng. Mặc định là 3.0.
Chiều Rộng Vùng Tối Thiểu (Pips): Chiều rộng tối thiểu một vùng phải có để hiển thị. Mặc định là 0.1. Tăng để lọc các vùng cực hẹp.
Tuổi Vùng Tối Đa (Thanh): Tuổi tối đa của một vùng tính bằng thanh. Các vùng cũ hơn sẽ bị loại bỏ. Mặc định là 0 (tắt).
BẢN ĐỒ NHIỆT
Kiểu Bản Đồ Nhiệt: Chọn giữa Tắt, Đa Màu hoặc Đơn Màu. Đa Màu sử dụng toàn bộ phổ từ xanh dương đến đỏ. Đơn Màu sử dụng các biến thể của màu vùng đã chọn.
Chiều Rộng Dải Tối Thiểu (Pips): Chiều rộng tối thiểu của các dải bản đồ nhiệt riêng lẻ. Mặc định là 0.1.
Số Nến Tối Thiểu Cho Bản Đồ Nhiệt: Số nến tối thiểu phải chồng lấn một dải để nó được hiển thị. Mặc định là 4. Tăng để chỉ hiển thị các dải hoạt động nhất.
ĐIỂM SỐ SỨC MẠNH
Trọng Số Thân: Trọng số gán cho các nến thân trong vùng trong điểm sức mạnh. Mặc định là 2.0. Giá trị cao hơn ưu tiên các nến có thân trong vùng.
Trọng Số Bấc: Trọng số gán cho các nến chỉ bấc trong điểm sức mạnh. Mặc định là 1.0. Giá trị thấp hơn giảm tầm quan trọng của các lần chạm chỉ bấc.
Điểm Sức Mạnh Tối Thiểu: Điểm sức mạnh tối thiểu cần thiết để một vùng được hiển thị. Mặc định là 0 (tắt). Tăng để lọc các vùng yếu.
HÌNH ẢNH
Phần Trăm Độ Mờ Lớp Phủ: Độ mờ của lớp phủ vùng. Mặc định là 50 phần trăm.
Phần Trăm Cường Độ Màu: Cường độ màu của vùng. Mặc định là 120 phần trăm.
Bật Phai Mờ Theo Tuổi: Khi bật, các vùng sẽ mờ dần theo tuổi. Mặc định là false.
Hiển Thị Viền Cốt Lõi: Khi bật, một viền được vẽ quanh vùng. Mặc định là true.
Độ Dày Viền: Độ dày của viền vùng. Mặc định là 1.
Màu Vùng: Màu sử dụng cho các vùng khi bản đồ nhiệt tắt hoặc ở chế độ Đơn Màu. Mặc định là Vàng.
Hiển Thị Nhãn: Khi bật, một nhãn được hiển thị trên mỗi vùng. Mặc định là false.
Hiển Thị Sức Mạnh Trong Nhãn: Khi bật, điểm sức mạnh được hiển thị trong nhãn. Mặc định là false.
Vị Trí Nhãn: Vị trí của nhãn trên vùng: Trên, Giữa hoặc Dưới. Mặc định là Giữa.
Màu Nhãn: Màu của nhãn vùng. Mặc định là Trắng.
Mở Rộng Thanh Phải: Số thanh để mở rộng vùng sang bên phải. Mặc định là 0.
CẢNH BÁO
Cảnh Báo Khi Nhập Lại Vùng: Khi bật, cảnh báo được kích hoạt khi giá nhập lại vùng. Mặc định là false.
Thời Gian Chờ Cảnh Báo (Thanh): Số thanh tối thiểu giữa các cảnh báo cho cùng một vùng. Mặc định là 5.
--------------------------------------------------
TRƯỜNG HỢP SỬ DỤNG
- Xác định các vùng hợp nhất cho các chiến lược bứt phá hoặc hồi quy trung bình
- Sử dụng điểm số thân trong vùng so với chỉ bấc để đánh giá chất lượng vùng
- Bản đồ nhiệt tiết lộ các mức giá hoạt động nhất trong mỗi vùng
- Cảnh báo nhập lại vùng giúp bắt các lần kiểm tra lại các mức quan trọng
- Sử dụng với các chỉ báo xu hướng để lọc vùng theo hướng thị trường
- Đặt điểm dừng trên hoặc dưới các vùng hợp nhất chất lượng cao
--------------------------------------------------
QUY TRÌNH ĐỀ XUẤT
Bước 1: Gắn chỉ báo vào biểu đồ của bạn với cài đặt mặc định.
Bước 2: Xác định các vùng có điểm sức mạnh cao và tỷ lệ thân trong vùng cao.
Bước 3: Xem bản đồ nhiệt để thấy nơi hoạt động giá tập trung.
Bước 4: Sử dụng các vùng làm mức hỗ trợ/kháng cự tiềm năng cho việc vào và thoát lệnh.
Bước 5: Bật cảnh báo nhập lại vùng để bắt các lần kiểm tra lại.
--------------------------------------------------
VÍ DỤ THỰC TẾ
Trên biểu đồ EURUSD H1, chỉ báo phát hiện một vùng hợp nhất giữa 1.0850 và 1.0875 với 10 nến liên tiếp. Vùng có 8 nến thân trong vùng và 2 nến chỉ bấc, cho điểm sức mạnh là 18 (8*2 + 2*1).
Bản đồ nhiệt cho thấy hoạt động tập trung giữa 1.0860 và 1.0870 (dải đỏ), chỉ ra nơi giá đã dành nhiều thời gian nhất. Đây trở thành khu vực trọng tâm của bạn để vào lệnh.
Khi giá phá vỡ lên trên vùng và sau đó kiểm tra lại, cảnh báo nhập lại được kích hoạt, cung cấp cơ hội vào lệnh lần hai tiềm năng.
--------------------------------------------------
GHI CHÚ KỸ THUẬT
- Chỉ báo phủ (vẽ trên biểu đồ giá)
- Hoạt động trên mọi khung thời gian và ký hiệu
- Chế độ quay lại có thể cấu hình (theo thanh hoặc giờ)
- Không vẽ lại; các phép tính là lịch sử
- Tối ưu hóa hiệu suất
- Tương thích với cTrader
--------------------------------------------------
HỖ TRỢ
Cập nhật trọn đời được bao gồm.
ĐỂ BIẾT THÊM THÔNG TIN - Nhấp vào Hồ sơ Nhà phát triển bên dưới.
Tóm tắt
The indicator presents a dynamic heatmap within each zone, highlighting price levels with the highest trading activity using color gradients from cool (low activity) to warm (high activity). Adjacent zones that overlap in price and are close in time can be merged to reduce chart clutter and form broader zones. Zones can fade as they age to maintain focus on recent price action.
Additional features include configurable lookback periods (bars or hours), customizable visual settings (color, opacity, border thickness, labels), and optional alerts for price re-entry into detected zones. The scanner supports filtering zones by strength score and provides practical use cases for breakout or mean-reversion strategies, stop placement, and identifying key support and resistance levels. Calculations are historical with no repainting, optimized for performance.
















![Logo "[Stellar Strategies] Smart ADX"](https://cdn.ctrader.com/image/webp/af13b084-b6f6-41db-b7bc-c7e688b57b05_36929)




![Logo "Smart Money Concepts (SMC) [Iridio Capital]"](https://cdn.ctrader.com/image/webp/b4b5414d-a5ca-44b7-a947-e28eca44a218_61548)
![Logo "Gaussian Channel [Iridio Capital]"](https://cdn.ctrader.com/image/webp/2c4f9ca9-4e9b-476d-b5a6-787c8095032b_61546)