정밀 FVG 분석 - 전문 공정 가치 갭 지표
개요
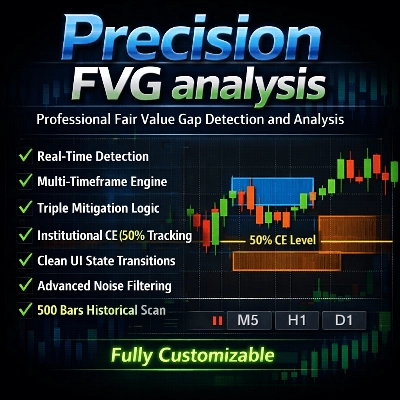
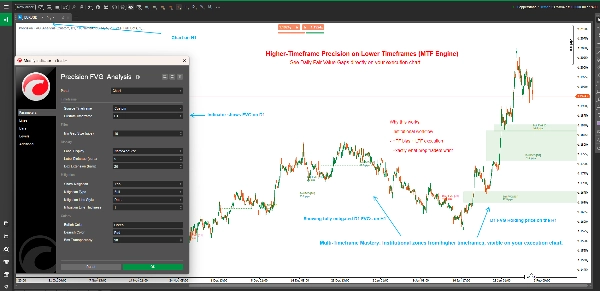
정밀 FVG 분석은 스마트 머니 컨셉(SMC) 및 ICT 방법론을 활용하는 진지한 트레이더를 위해 설계된 강력하고 유연한 공정 가치 갭(FVG) 탐지 지표입니다. 이 고급 지표는 여러 타임프레임에 걸쳐 공정 가치 갭을 자동으로 식별, 추적 및 시각화하며 정교한 완화 추적 기능을 제공합니다.
공정 가치 갭은 가격이 너무 빠르게 움직여 비효율성이 남는 시장의 불균형을 나타내며, 종종 다시 방문되는 영역입니다. 이러한 갭을 이해하고 거래하는 것은 현대 가격 행동 트레이더에게 매우 중요합니다.
주요 특징
🎯 다중 타임프레임 분석
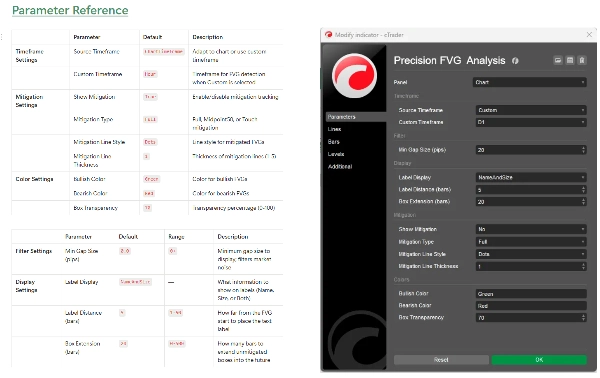
- 적응형 타임프레임 감지: 현재 차트 타임프레임 또는 사용자 지정 타임프레임에서 FVG 표시 선택 가능
- 크로스 타임프레임 거래: 낮은 타임프레임 차트에서 높은 타임프레임 FVG를 확인하여 더 나은 거래 컨텍스트 제공
- 스마트 타임프레임 라벨: 사용자 지정 타임프레임 사용 시 라벨에 자동 타임프레임 식별
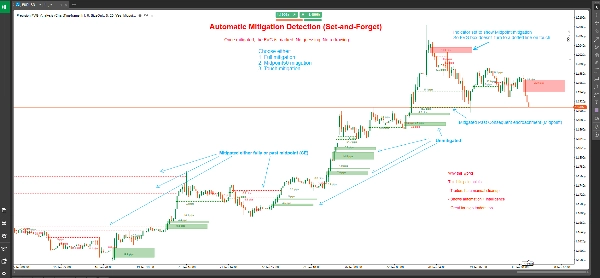
📊 고급 완화 추적
- 세 가지 완화 유형:
-
- 완전 완화: 가격이 갭 전체를 완전히 채움 (가장 보수적)
- 50% 중간점 (CE): 가격이 결과적 침범 수준에 도달 (균형 잡힌 접근)
- 터치 완화: 가격이 갭 경계에 닿음 (가장 민감함)
- 시각적 상태 변화: 완화되지 않은 FVG는 채워진 상자로 표시되고, 완화된 FVG는 점선으로 변환
- 정확한 완화 표시: 완화가 발생한 정확한 캔들을 표시
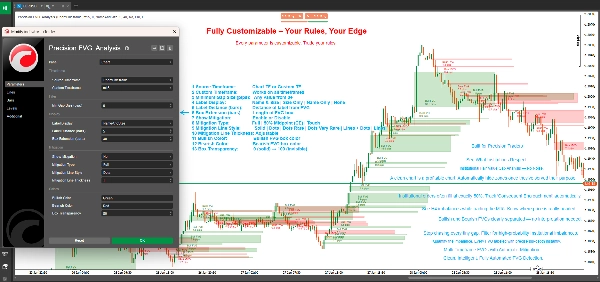
🎨 완전 맞춤형 표시
- 유연한 박스 확장: FVG 박스가 미래로 얼마나 확장될지 제어 (0-500 바)
- 스마트 라벨링 시스템: 네 가지 라벨 모드 중 선택 가능:
-
- 이름 및 크기: FVG 유형과 핍 크기를 포함한 전체 세부 정보
- 크기만: 핍 단위의 갭 크기만 표시
- 이름만: FVG 유형 식별
- 없음: 라벨 없는 깔끔한 차트
- 사용자 지정 색상: 강세 및 약세 색상 체계 분리
- 조절 가능한 투명도: 박스 투명도 0-100%
- 완화선 사용자 지정: 완화된 FVG의 선 스타일과 두께 선택 가능
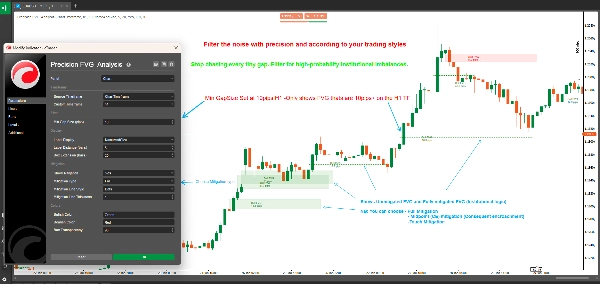
⚙️ 전문 필터링
- 최소 갭 크기 필터: 중요하지 않은 갭을 걸러내기 위한 최소 핍 요구 사항 설정
- 자동 감지: 새로운 캔들 마감 시 실시간 FVG 식별
- 과거 스캔: 초기화 시 최대 500개의 과거 바 자동 스캔
공정 가치 갭이란?
공정 가치 갭(FVG)은 세 개의 연속된 캔들 사이에 가격 비효율성이 있을 때 발생합니다:
강세 FVG: 현재 캔들의 저점이 두 바 전 캔들의 고점보다 높고, 중간 캔들이 그 고점 위에서 마감할 때 형성됩니다. 이는 종종 지지 역할을 하는 상승 갭을 만듭니다.
약세 FVG: 현재 캔들의 고점이 두 바 전 캔들의 저점보다 낮고, 중간 캔들이 그 저점 아래에서 마감할 때 형성됩니다. 이는 종종 저항 역할을 하는 하락 갭을 만듭니다.
이러한 갭은 공격적인 매수 또는 매도가 발생한 영역을 나타내며, 시장이 원래 방향으로 계속 진행하기 전에 "공정 가치"를 위해 자주 다시 방문하는 가격 불균형을 남깁니다.
완화 유형 이해하기
완전 완화 (보수적)
- 강세 FVG: 가격이 갭 하단 아래로 거래될 때 완화됨
- 약세 FVG: 가격이 갭 상단 위로 거래될 때 완화됨
- 사용 사례: 갭이 완전히 채워졌음을 확인하며, 스윙 트레이더 및 확인을 원하는 전략에 적합
50% 중간점 / CE (균형적)
- 강세 FVG: 가격이 중간점에 도달하거나 그 아래로 교차할 때 완화됨
- 약세 FVG: 가격이 중간점에 도달하거나 그 위로 교차할 때 완화됨
- 사용 사례결과적 침범(CE) 수준은 기관들이 주문을 배치하는 곳으로, 좋은 위험 대비 보상을 가진 진입에 이상적
터치 완화 (공격적)
- 강세 FVG: 가격이 상단 경계에 닿거나 교차할 때 완화됨
- 약세 FVG: 가격이 하단 경계에 닿거나 교차할 때 완화됨
- 사용 사례FVG 경계에서 반응을 포착하려는 트레이더를 위한 조기 경고 시스템으로, 스캘핑 및 빠른 진입에 이상적
사용 방법
기본 설정
- 차트에 정밀 FVG 분석 추가
- 선호하는 소스 타임프레임 설정:
-
- 현재 차트에서 FVG를 감지하려면 "ChartTimeframe" 선택
- 특정 타임프레임(H4, D1 등)을 선택하여 더 높은 타임프레임 FVG 보기
- 작고 중요하지 않은 갭을 걸러내기 위해 최소 갭 크기 구성 (권장: 외환의 경우 2-5 핍)
완화 구성
- 완화 추적 활성화를 위해 완화 표시 활성화
- 거래 스타일에 따라 완화 유형 선택:
-
- 일일 트레이더 및 스캘퍼: "터치" 또는 "중간점50" 고려
- 스윙 트레이더: 확인을 위해 "완전" 사용
- 선 스타일 및 두께로 완화선 모양 사용자 지정선 스타일 및 두께
시각적 사용자 지정
- 박스가 얼마나 멀리 투사될지 제어하기 위해 박스 확장 설정 (기본값 20 바)
- 선호하는 라벨 표시 선택
- 차트 테마에 맞게 강세 색상 및 약세 색상 조정
- 최적의 가시성을 위해 박스 투명도 미세 조정
거래 전략
전략 1: 낮은 타임프레임 진입과 함께 높은 타임프레임 FVG
- M15 또는 M5 차트에서 지표를 H4 또는 D1 타임프레임으로 설정
- 완화되지 않은 높은 타임프레임 FVG 식별
- 가격이 낮은 타임프레임에서 FVG에 접근할 때까지 대기
- 낮은 타임프레임 확인(캔들스틱 패턴, 주문 블록 등) 찾기
- 선택한 완화 수준에 가격이 도달하면 진입
전략 2: FVG 합류 구역
- 다른 타임프레임으로 지표를 여러 번 사용
- 여러 타임프레임 FVG가 겹치는 영역 식별
- 이 합류 구역은 높은 확률의 거래 위치 제공
- 완화 추적을 사용하여 진입 시점 정확히 조절
전략 3: 돌파 확인
- 주요 지지/저항 수준 식별
- 돌파 중 FVG 형성 관찰
- 돌파 방향의 완화되지 않은 FVG는 지속 신호
- 완화된 FVG는 실패한 돌파 또는 반전을 시사
전략 4: 완화 기반 스캘핑
- 낮은 타임프레임(M1, M5)에서 터치 완화 사용
- FVG에 닿으면 즉시 진입
- 이전 스윙 고점/저점 목표 설정
- FVG 아래/위에 타이트한 스톱 사용
기술 사양
- 플랫폼: cTrader
- 유형: 오버레이 지표
- 계산: 바 마감 시 실시간
- 과거 바: 초기화 시 최대 500 바 스캔
- 최대 활성 FVG: 동시 500 개 갭
- 리소스 사용량: 경량 및 성능 최적화
최고의 실천법
일반 거래 지침
- 다른 개념과 결합: FVG는 주문 블록, 유동성 풀, 시장 구조와 결합할 때 가장 효과적
- 시장 컨텍스트 존중: 높은 타임프레임 FVG가 낮은 타임프레임보다 더 중요
- 다중 타임프레임 사용: 합류를 위해 다양한 타임프레임 FVG 레이어링
- 위험 관리: 항상 적절한 손절매 사용; 모든 FVG가 유지되는 것은 아님
최적화 팁
- 최소 갭 크기 조정: 사용 중인 상품의 평균 변동성에 따라 설정
- 박스 확장: 스윙 거래는 더 길게(50-100 바), 일일 거래는 더 짧게(10-20 바)
- 완화 유형: 거래 타임프레임과 스타일에 맞게 조정
- 라벨 거리: 차트 혼잡도 및 확대 수준에 따라 조정
피해야 할 일반적인 함정
- 과도한 거래: 모든 FVG가 거래 기회는 아님
- 컨텍스트 무시: 강한 추세에 반하는 FVG는 신뢰도가 낮음
- 잘못된 완화 유형: 완전 완화를 사용하는 스캘퍼는 진입을 놓치고, 터치를 사용하는 스윙 트레이더는 스톱아웃 당함
- 확인 없음: 항상 FVG 수준에서 가격 행동 확인을 기다림
자주 묻는 질문
Q: 왜 일부 FVG는 즉시 사라지나요? A: "완화 표시"가 "터치" 완화와 함께 활성화되면 즉시 되돌려진 FVG는 빠르게 점선으로 변환됩니다. 이는 정상적인 동작입니다.
Q: 여러 타임프레임 FVG를 동시에 볼 수 있나요? A: 네! 차트에 지표를 여러 번 추가하고 서로 다른 사용자 지정 타임프레임을 설정하여 다중 타임프레임 분석이 가능합니다.
Q: 이 지표와 다른 FVG 지표의 차이점은 무엇인가요? A: 정밀 FVG 분석은 다중 타임프레임 기능, 세 가지 완화 유형, 상태 기반 렌더링(박스 대 점선)을 통한 우수한 시각적 명확성을 제공합니다.
Q: 어떤 완화 유형을 사용해야 하나요? A: 신호의 조기성과 신뢰성의 균형을 맞춘 Midpoint50 (CE)부터 시작하세요. 결과와 거래 스타일에 따라 조정하세요.
Q: 모든 상품에 적용되나요? A: 네, 이 지표는 외환, 지수, 원자재, 암호화폐에 적용됩니다. 상품 변동성에 따라 "최소 갭 크기" 매개변수를 조정하세요.
Q: 과거 스캔은 얼마나 거슬러 올라가나요? A: 이 지표는 초기화 시 최대 500 바를 스캔하여 포괄적인 과거 컨텍스트를 제공합니다.
지원 및 업데이트
이 지표는 적극적으로 유지 관리 및 업데이트됩니다. 사용자는 다음을 받습니다:
- 새로운 기능이 포함된 정기 업데이트
- 성능 최적화
- 버그 수정 및 개선
- 문서 업데이트
질문, 제안 또는 지원이 필요하면 cTrader 스토어 메시징 시스템을 통해 문의하세요.
면책 조항
거래는 상당한 손실 위험을 수반하며 모든 투자자에게 적합하지 않습니다. 과거 실적은 미래 결과를 보장하지 않습니다. 이 지표는 분석 도구일 뿐이며 금융 조언을 구성하지 않습니다. 항상 적절한 위험 관리를 실천하고 감당할 수 있는 이상으로 위험을 감수하지 마십시오.
버전 기록
버전 1.0 (현재)
- 다중 타임프레임 FVG 감지
- 세 가지 완화 유형 (완전, 중간점50, 터치)
- 시각적 상태 변화 (박스에서 점선으로)
- 사용자 지정 색상 및 투명도
- 유연한 라벨링 시스템
- 과거 스캔 (500 바)
- 실시간 감지 및 추적
정밀 FVG 분석 - 공정 가치 갭 거래를 전문 수준으로 끌어올리세요.
5 | 100 % | |
4 | 0 % | |
3 | 0 % | |
2 | 0 % | |
1 | 0 % |