
VolumeRenkoRange
インジケーター
1.41K ダウンロード数
バージョン 1.1、Jan 2026
Windows、Mac
5.0
レビュー: 1
説明
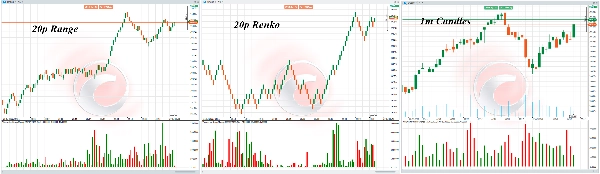
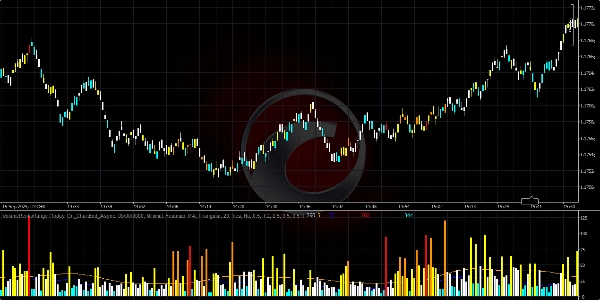
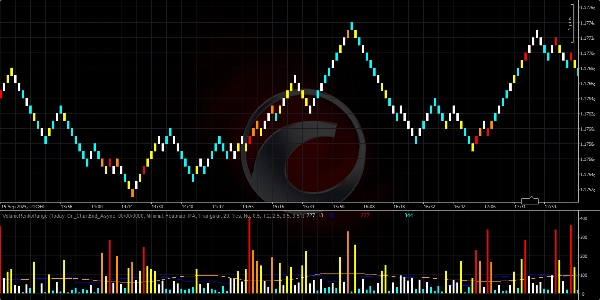
VolumeRenkoRange は価格ベースのチャートにティックボリュームのロジックを適用します。
キャンドルと同様に、ボリュームの計算にティックデータを使用します。
バーのオープン/クローズ時間があるため、可能です:
ボリュームロジック = バーの形成中(OpenTimeとCloseTimeの間)の価格更新(ティック)の数。
rev.1の新機能は?
すべての「Order Flow Aggregated」に関連する改善を含みます
- 高性能なVolumeTick()
- 非同期ティックデータ収集
- ヒートマップ/フェーディングカラーリング
概要
AIによる概要
VolumeRenkoRange is an indicator designed for price-based charts such as Renko and Range charts. It applies tick volume logic by calculating the number of price updates (ticks) that occur during the formation of each bar, using the bar's open and close times. This approach enables volume measurement on non-time-based charts similarly to traditional candlestick charts. The indicator incorporates high-performance tick volume calculation, asynchronous tick data collection, and visual enhancements like heatmap and fading coloring to represent volume intensity. It is part of a suite of cTrader Store indicators focused on order flow and volume analysis.
インジケーターのプロフィール
カスタマーレビュー
5.0
レビュー: 1
5 | 100 % | |
4 | 0 % | |
3 | 0 % | |
2 | 0 % | |
1 | 0 % |
カスタマーレビュー
July 9, 2025
Pros: Displays volume-based Renko blocks, filtering noise and highlighting impulsive moves. Flexible settings, stable performance. Cons: No tooltips or alerts. No template saving. Requires additional confirmation tools for reliable trading decisions.
ディスカッション
よくあるご質問
VWAP
cTrader Storeで入手可能な取引ボット、インジケーター、プラグインなどの商品は、第三者の開発者が提供するものであり、情報と技術の取得のみを目的としてご利用いただけます。cTrader Storeはブローカーではなく、投資助言や個人的な推奨を行うことも、将来のパフォーマンスを保証することもありません。


![「Smart Money Concepts (SMC) [Iridio Capital]」ロゴ](https://cdn.ctrader.com/image/webp/28b69fd1-ef54-4bed-9487-07e78e883be4_40934)


価格
登録日 12/12/2024
1
販売
33.31K
無料インストール