
Weis & Wyckoff System v2.0
インジケーター
2.39K ダウンロード数
バージョン 1.1、Jan 2026
Windows、Mac
5.0
レビュー: 3
説明
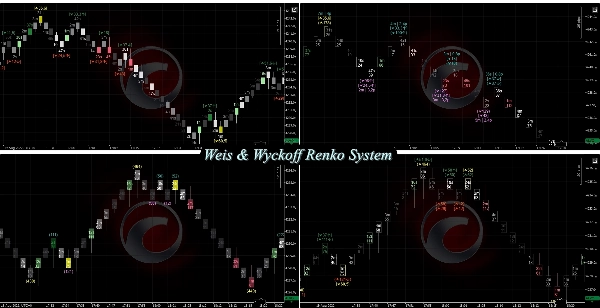
ワイス&ウィコフシステム は現在 あらゆるチャートをサポートしています! [キャンドル、ティック、レンコ、レンジ、平均足]
最終説明 -> 2025/11/11
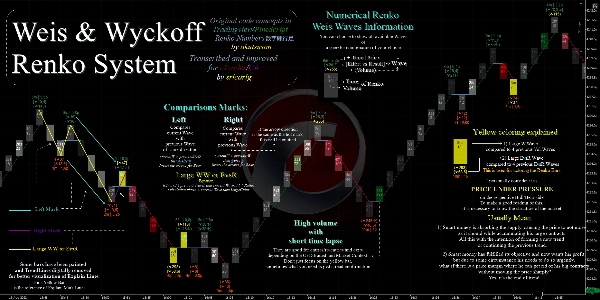
ワイス&ウィコフシステムは デイビッド・H・ワイス と リチャード・ウィコフの概念を紹介します
リビジョン1の新機能は?
- [キャンドル、平均足、ティック、レンジ]チャートのサポート
- 改良されたジグザグ => MTFサポート + [ATR、パーセンテージ、ピップス、NoLag_HighLow]モード
- すべての「オーダーフロー集約」関連の改善を含む
-
- カスタム移動平均線
- パフォーマンス描画
- 強度フィルター (MA/標準偏差/両方)
- 高性能VP_Tick()
- 高性能GetWicks()
- 非同期ティックデータ収集
- 修正 => MacOSのパラメータパネル
==========================
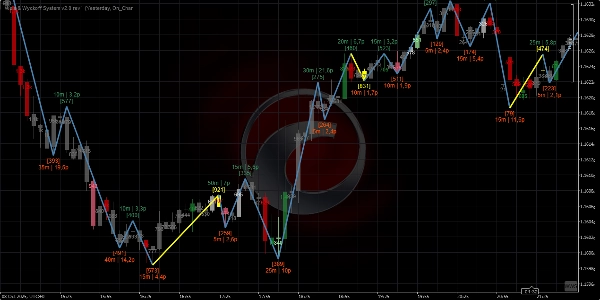
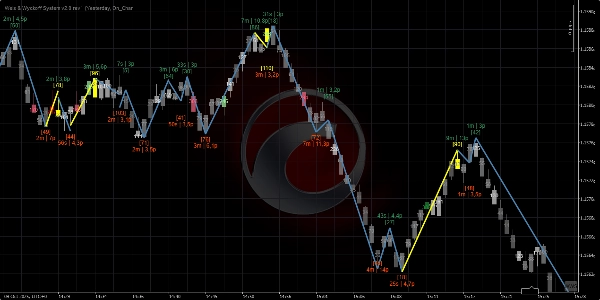
これは波とボリュームを数値的に視覚化する方法に過ぎず、オリジナルのアイデアではありません。
この視覚化方法は最初に以下で見つけることができます:
これは以下のコードコンセプトを使用しています:
- (Numbers-Renko 数字練行足 in PineScript)、
- 感謝を込めて akutsusho!へ。
私が 改良し 、cTrader/C#に移植しました そして無料/オープンソースです。
=========================================
cTrader/C#用に転写&改良
srlcarlgによる
TradingView/Pinescriptのオリジナルコードコンセプト
akutsushoによる
=========================================
常にcTraderのストア版を優先してください。そちらが最初に更新されます。
私が開発したすべてのインジケーターはオープンソースです。 コードにアクセスできない場合は、こちらの Githubリポジトリをチェックしてください。
概要
AIによる概要
Weis & Wyckoff System v2.0 is an open-source trading indicator for the cTrader platform that visualizes market waves and volume based on the concepts of David H. Weis and Richard Wyckoff. It supports multiple chart types including Candles, Heikin-Ashi, Tick, Range, and Renko charts. The system numerically displays wave patterns and volume dynamics to assist in market analysis.
Key features include:
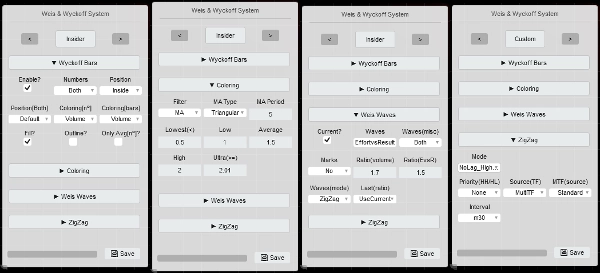
- A versatile Params Panel with four layout templates (Insider, Time, Volume, BigBrain) for quick and user-friendly customization.
- Enhanced ZigZag functionality with multi-timeframe support and multiple modes such as ATR, Percentage, Pips, and NoLag High/Low.
- Integration of order flow aggregation improvements, including custom moving averages, performance drawing, strength filters (MA, StdDev, or both), and high-performance tick volume and wick calculations.
- Dynamic TimeLapse feature showing time waves across various intervals from milliseconds to days.
- Compatibility with Mac OS and requires .NET 6.0 or higher.
The indicator is a C# adaptation and improvement of original PineScript concepts, designed to provide detailed wave and volume visualization without repainting options. It is maintained as open source, with code available on GitHub for transparency and further development.
Key features include:
- A versatile Params Panel with four layout templates (Insider, Time, Volume, BigBrain) for quick and user-friendly customization.
- Enhanced ZigZag functionality with multi-timeframe support and multiple modes such as ATR, Percentage, Pips, and NoLag High/Low.
- Integration of order flow aggregation improvements, including custom moving averages, performance drawing, strength filters (MA, StdDev, or both), and high-performance tick volume and wick calculations.
- Dynamic TimeLapse feature showing time waves across various intervals from milliseconds to days.
- Compatibility with Mac OS and requires .NET 6.0 or higher.
The indicator is a C# adaptation and improvement of original PineScript concepts, designed to provide detailed wave and volume visualization without repainting options. It is maintained as open source, with code available on GitHub for transparency and further development.
インジケーターのプロフィール
カスタマーレビュー
5.0
レビュー: 3
5 | 100 % | |
4 | 0 % | |
3 | 0 % | |
2 | 0 % | |
1 | 0 % |
カスタマーレビュー
December 25, 2025
July 9, 2025
Pros: Visualizes wave structure and market phases using Renko and volume, following Wyckoff principles. Flexible settings, clear structure recognition. Cons: No tooltips or alerts. Requires Renko charts, less applicable on standard timeframes. Demands experience for interpretation.
May 13, 2025
its amazing indicator and thanks for coding this. Can you do this for range chart.
ディスカッション
よくあるご質問
ZigZag
VWAP
cTrader Storeで入手可能な取引ボット、インジケーター、プラグインなどの商品は、第三者の開発者が提供するものであり、情報と技術の取得のみを目的としてご利用いただけます。cTrader Storeはブローカーではなく、投資助言や個人的な推奨を行うことも、将来のパフォーマンスを保証することもありません。


これも好きかも


価格
登録日 12/12/2024
1
販売
33.23K
無料インストール