
Beschreibung
Pinescriptlabs Store Indikatoren: Pinescriptlabs Store cBots : (cBot) Gold & BTC BreakoutSession Pivots(neu)
Erweiterte Marktstruktur: Bos, Choch, SwinLevels, Order Blocks, Marktstruktur & Liquiditätsfinder (Neu)
ZigZag Preis-Liquiditätsprojektion
Trailing Smart Algorithmus (neu)
Vorhersage basierend auf Linreg & ATR
SmartTrend Unterstützung &
Widerstand
Linien
Dynamische
Marktstruktur
Analyse
von
Wendepunkten
Punkten
Fibonacci
Lineare
Regression
Multi-Zeitrahmen
Mehrstufiger
Kerzen-Bias
Tracker
Reaktive gleitende Durchschnitt
Auto
Unterstützung und
Widerstand
Trend
Linien
Alle
Unterstützungs- und
Widerstandsniveaus
Levels
🌟 Großartige Leistung des Teams bei der Entwicklung dieses Ctrader-Indikators! Unterstützen Sie uns durch Teilen - visuelle Verbesserungen einschließlich horizontalem Scrollen kommen bald!
⚠️ Technischer Hinweis: Manuelles Zoomen/Scrollen derzeit für optimale Ansicht erforderlich ("Vorübergehende Einschränkung: Funktioniert am besten auf Zeitrahmen unter 1H aufgrund visueller Einschränkungen der Ctrader-Plattform")
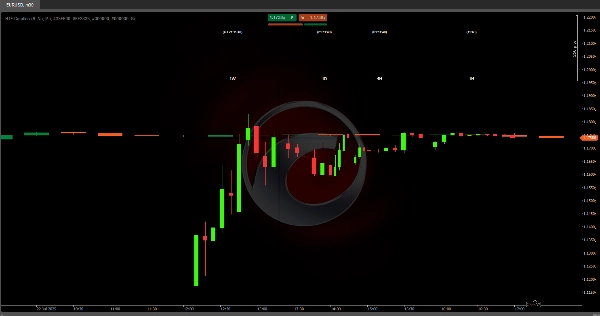
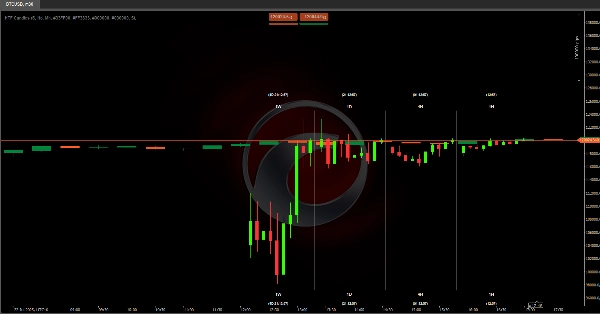
📊 Echtzeit-HTF-Visualisierung
Dieser Algorithmus zeigt Kerzen höherer Zeitrahmen (1W, 1D, 4H, 1H) direkt in Ihrem Handelschart an und gibt Ihnen die komplette Marktstruktur auf einen Blick - kein Fensterwechsel nötig!
🔍 Schnelle Analyse
Erkennen Sie Haupttrends (tägliche/wöchentliche Richtung) beim Handel auf niedrigeren Zeitrahmen
• Erweiterte Funktion: HTF-Kerzen aktualisieren sich in Echtzeit - Farbwechsel zeigen sofort Momentumverschiebungen
⚙️ Anwendung
• Einzelne HTF-Blöcke ein-/ausschalten
• Sichtbare Kerzen anpassen (1-10 pro Zeitrahmen)
💡 Revolutionäre Vorteile
Jetzt können Sie:
1️⃣ Wichtige Kerzenschlüsse antizipieren
2️⃣ Trendwenden live erkennen
3️⃣ Wichtige Niveaus über mehrere Zeitrahmen gleichzeitig überwachen
🚀 Kommende Verbesserungen
Horizontales Scrollen ermöglicht:
• Historische HTF-Musteranalyse
• Vergleich aktuelle vs. vergangene Struktur
• Identifikation wichtiger Zonen auf höheren Zeitrahmen
📚 Praktische Beispiele
• Wenn 1W = grün & 1D = rot → Markt korrigiert innerhalb eines Aufwärtstrends → Nur Short bei wichtigen Widerstandsprungbällen
• Trendhierarchie: 1W > 1D > 4H > 1H → Immer mit der Wochenkerzenrichtung handeln
• Konfluenz-Einstiege:
- Preis am 1D-Support + entstehende grüne 4H-Kerze = Long-Chance
- Widerstand am 1H-Hoch + rote 4H-Kerze = Short mit Stopp über dem Hoch
• Ausbruchsmuster: - Wenn 1H-Kerze vorheriges Hoch vor Schluss durchbricht (Timer aktiv), erwarten Sie eine bullische Fortsetzung
Zusammenfassung
Users can toggle individual higher timeframe candle blocks on or off and adjust the number of visible candles per timeframe (1 to 10). This facilitates monitoring of key levels and trend directions across multiple timeframes simultaneously. Practical use cases include anticipating candle closings, detecting live trend reversals, and identifying confluence entries based on support, resistance, and candle color changes.
Due to platform visual constraints, manual zoom and scroll are currently required for optimal viewing, especially on timeframes below 1 hour. Planned updates will introduce horizontal scrolling to enable historical pattern analysis, comparison of current versus past structures, and identification of key zones on higher timeframes.
HTF Candles supports traders in aligning trades with higher timeframe trends and enhances multi-timeframe market analysis within a single chart view.


