
PulseTracker
مؤشر
238 التنزيلات
الإصدار 1.0، Mar 2025
Windows, Mac
الوصف
افتح التداول الدقيق مع تقنيتنا الثورية لتتبع الاتجاهات
BrickAlgo TrendTracker هو المؤشر النهائي لتحديد الاتجاهات المصمم خصيصًا لـ cTrader. تساعدك هذه الأداة التقنية القوية على اكتشاف انعكاسات السوق الرئيسية بسهولة، مع توفير إشارات بصرية واضحة لنقاط الدخول والخروج المثلى.
الميزات الرئيسية:
- كشف الاتجاه الديناميكي: يحدد تغييرات الاتجاه بناءً على تحليل حركة السعر
- نظام الإشارات البصرية: الأسهم الملونة تظهر تحولات الاتجاه الصعودي والهبوطي
- تتبع الأداء: عرض اختياري لقيمة النقاط يظهر الربح/الخسارة بين الإشارات
- إعدادات قابلة للتخصيص: ضبط المعلمات لتتناسب مع أسلوب التداول والإطار الزمني الخاص بك
- واجهة مخطط نظيفة: تصميم تراكبي يحافظ على مخططاتك خالية من الفوضى
كيف يعمل:
يقوم BrickAlgo TrendTracker بتحليل تحركات السعر من خلال مقارنة القيم الحالية بمتوسطات ملساء لأسعار الارتفاع والانخفاض. عند اكتشاف تغيير نمطي مهم، يولد المؤشر إشارة تساعدك على تحديد انعكاسات الاتجاه المحتملة قبل أن تصبح واضحة للمتداولين الآخرين.
إليك شرح موجز لكيفية استخدام المؤشر:
- تحميل المؤشر: أضف المؤشر إلى مخططك من قائمة المؤشرات في cTrader.
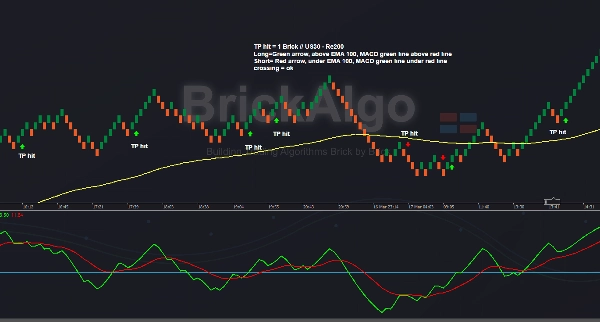
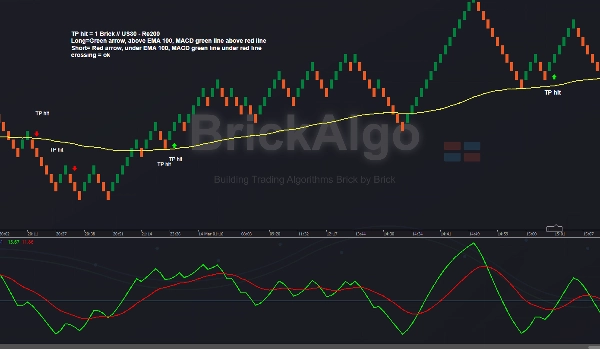
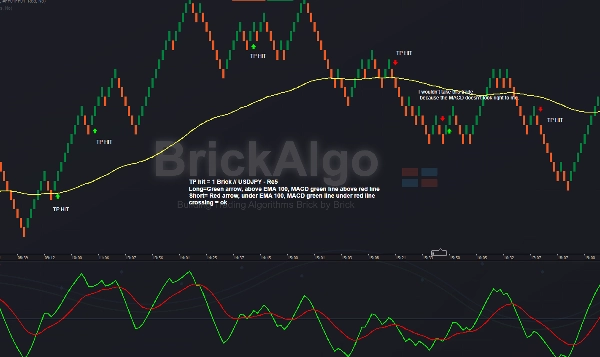
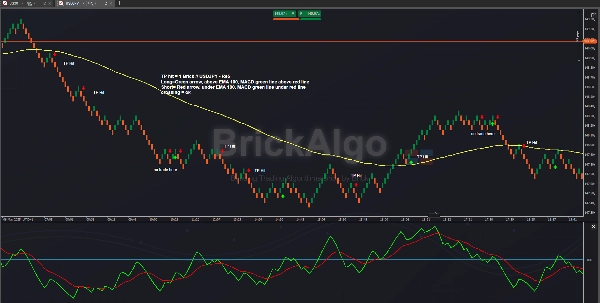
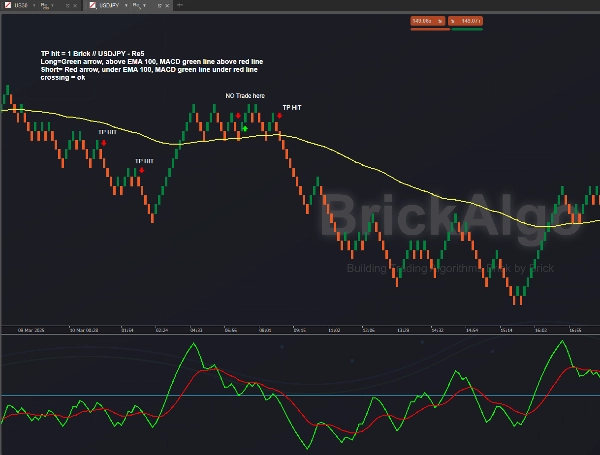
- استخدام مخطط رينكو (مثلاً، Re5): تأكد من استخدامك لمخطط رينكو، مثل Re5، وهو مجرد مثال. يعمل المؤشر مع أحجام الطوب المختلفة. شخصيًا، أتداول USDJPY على Re5 و US30 على Re100 و Re200 باستخدام هذا المؤشر.
- ضبط الإعدادات: راجع لقطات الشاشة المرفقة للإعدادات الموصى بها للمؤشر.
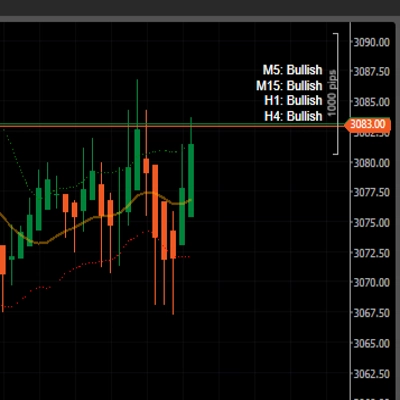
- تصفية الإشارات: للحصول على تأكيد أفضل للصفقات، استخدم MACD كما هو موضح في لقطات الشاشة، تأكيد HTF، الدعم والمقاومة، EMA، أو مؤشرات BrickAlgo الأخرى مثل BrickAlgo TrendPulse.
- جني الأرباح وإيقاف الخسارة: أستخدم حجم طوبة واحدة لجني الأرباح (TP)، بينما يكون إيقاف الخسارة (SL) متغيرًا، عادة بين 1 و 3 طوبات.
أنا شخصيًا أفضل التداول USDJPY على مخطط Re5 وأستخدم 100 EMA و MACD، كما هو موضح في لقطات الشاشة. أستخدم BrickAlgo TrendPulse لأخذ صفقات إضافية.
الملخص
ملف تعريف المؤشر
تقييمات العملاء
0.0
التقييمات: 0
تقييمات العملاء
لا توجد تقييمات لهذا المنتج حتى الآن. هل جرَّبته بالفعل؟ كن أول من يخبر الآخرين!
مناقشة
الأسئلة الشائعة
Signal
MACD
USDJPY
يتم توفير المنتجات المتاحة من خلال cTrader Store، بما في ذلك روبوتات التداول والمؤشرات والإضافات، من قبل مطوري الطرف الثالث وإتاحتها لأغراض الوصول المعلوماتي والفني فقط. cTrader Store ليس وسيطًا ولا يقدم نصائح استثمارية أو توصيات شخصية أو أي ضمان للأداء المستقبلي.


السعر
منذ 21/02/2025
466.3M
حجم التداول
180.83K
الربح بالبيب
22
المبيعات
6.92K
التثبيتات المجانية