
Order Flow Ticks v2.0
インジケーター
12.13K ダウンロード数
バージョン 1.1、Jan 2026
Windows、Mac
4.4
レビュー: 23
説明
最終説明 -> 2025/11/11
すべての側面が Order Flow Ticks(集約版) はパフォーマンスを考慮して慎重に設計されており、低スペックのマシンでも動作します。
それでも、より良い使用のための 「ヒントとコツ」 をいくつか紹介します:
- ティックデータ はRAMに保存されますが、cTraderはすでに優れたメモリ管理を備えています:
-
- ライブトレードに本当に必要なものだけを読み込みます。
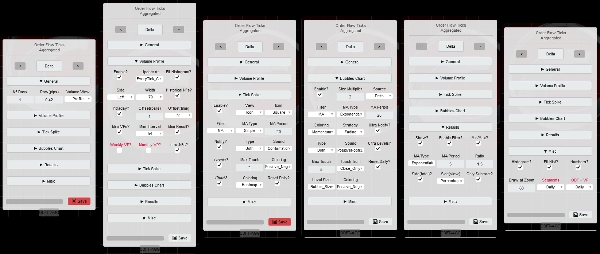
- パラメータパネル はすでに各モードでサポートされているパラメータを表示しています。
- セグメント間隔 はフィルター分析を変える可能性があるため、日中のモメンタムには 日次 間隔を使用してください。
- より高い時間枠では (価格ベースのチャートを含む)
-
- を ODF + VP に設定し、週次
- 日数/日次リセット? パラメータは現在週/週次です。
- すべてのフィルターは毎日ではなく毎週リセットされます。
- 「低時間枠」 と 「小さな行サイズ」:
-
- カスタムMA は 設定切替時 の再計算を高速化するために作られています。
- cTraderの移動平均を使い続けたい場合は、[ODF] カスタムMAを使う? を False に設定してください。
-
- フィルター [結果 / スパイク / バブル] が有効になっている場合は忍耐が必要です。
- もし 高性能 が必要なら:
-
- ボリュームプロファイルを無効にするか、代わりにミニVPを使用してください。 (デフォルト)
- 「特定設定」の「[VP] 更新戦略」で「同時」を使用してください。ただしRAM使用量が増えます。 (デフォルト)
- 「パフォーマンス描画」設定で「Redraw_Fastest」を使用してください。 (デフォルト)
- カスタムMAを使用してください。 (デフォルト)
- 多くの塗りつぶしやテキスト描画は非常に重くなります。
- バックテスト時、価格ベースのチャート上の一部の描画が壊れますが、リアルタイムでは正常に動作します。
- 保存された設定 は「Documents/cAlgo/LocalStorage/ODFT-AGG ...」に保存されます。
Order Flow Ticksの新しい分析機能:
- ティックスパイクフィルター
-
- 移動平均または標準偏差。
- アイコンまたはバブルとして。
- スパイクレベル。
- スパイクチャート(バブル):
-
- ヒートマップカラーリング。
- ポジティブ/ネガティブカラーリング。
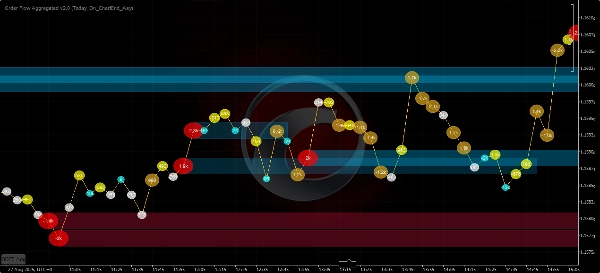
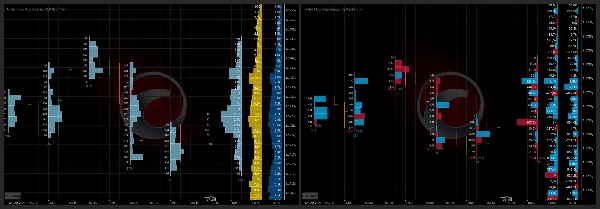
- バブルチャート
-
- 移動平均、標準偏差、またはその両方。
- [ボリュームデルタ / 累積デルタ変化 / デルタ差引] をソースとして。
- ウルトラバブルレベル。
- ヒートマップカラーリング。
- モメンタムカラーリング:
-
- フェードアウト
- ポジティブ/ネガティブ
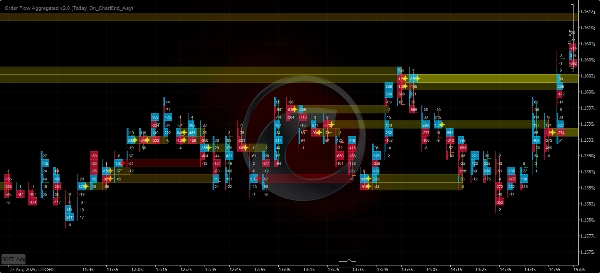
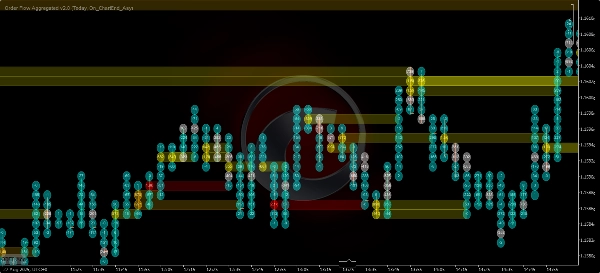
- ボリュームプロファイル
-
- ミニVP - 5分から1日まで。
- 日次、週次、月次プロファイル!
- 固定範囲プロファイル。
=============================
常にcTraderのストア版を優先してください。最初に更新されます。
私が開発したすべてのインジケーターはオープンソースです。 コードにアクセスできない場合は、 Githubリポジトリ をご覧ください。
概要
AIによる概要
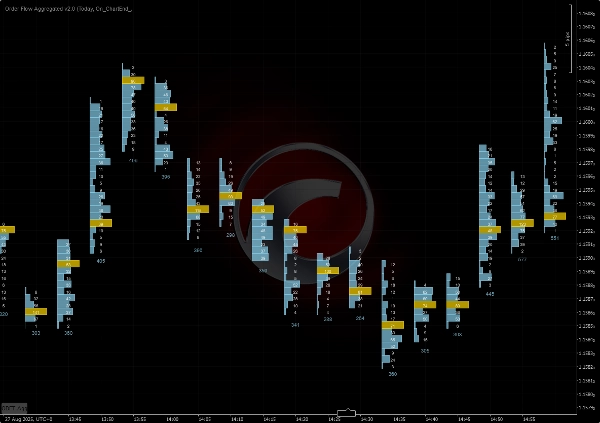
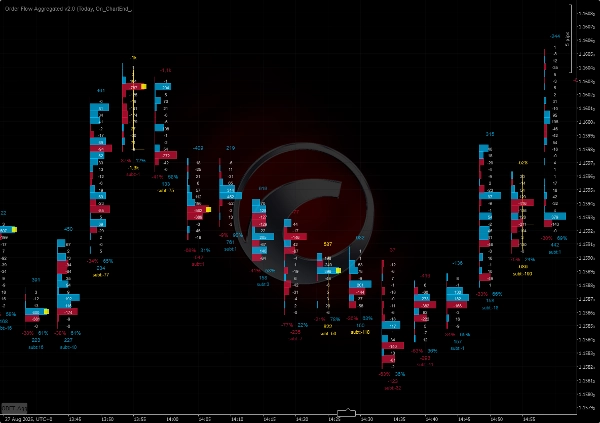
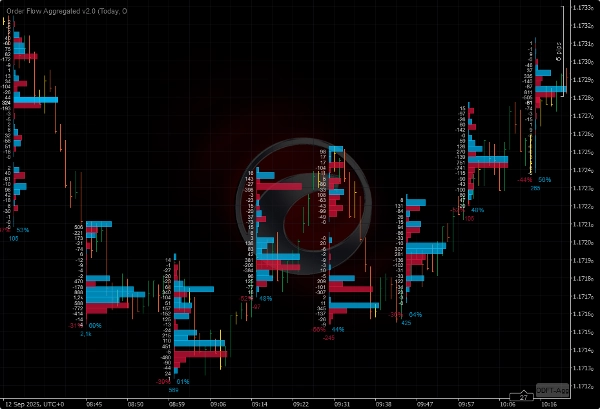
Order Flow Ticks v2.0 is an open-source indicator for the cTrader platform that adapts traditional Order Flow (Footprint) concepts to tick volume data. It supports multiple chart types including ticks, Renko, and range charts. The indicator offers several visualization modes: Normal Mode (volume profile per bar), Buy vs Sell Divided Mode (bid/ask footprint), Buy vs Sell Profile Mode, Delta Divided Mode (delta footprint), and Delta Profile Mode.
Version 2.0 introduces a parameters panel for quick switching between settings such as volume modes and row height, and it uses the Colors API exclusively. It is compatible with Mac OS and requires .NET 6.0 or higher.
Key features include:
- Tick Spike Filter with moving average or standard deviation, displayed as icons or bubbles with heatmap and positive/negative coloring.
- Bubbles Chart showing volume delta, cumulative delta change, or subtract delta with momentum coloring and ultra bubble levels.
- Volume Profile options including mini-profiles from 5 minutes to 1 day, daily, weekly, monthly, and fixed range profiles.
The indicator is optimized for performance to run efficiently on lower-end machines. It stores tick data in RAM and offers settings to balance performance and detail, including custom moving averages and concurrent update strategies. Saved settings are stored locally.
インジケーターのプロフィール
カスタマーレビュー
4.4
レビュー: 23
5 | 74 % | |
4 | 13 % | |
3 | 4 % | |
2 | 0 % | |
1 | 9 % |
カスタマーレビュー
May 13, 2026
Just a note to say thank you to the creator for making this free of charge. Appreciate it.
March 23, 2026
It's great, Thank you! Can you pls make an update, it doesnt work fully on Indices on CFD
March 9, 2026
"Thank you very much for your work on Order Flow Tick 2.0. It is truly excellent and unique."
October 22, 2025
this is great, i just can't see all the options because the panel is cut short. i don't have access to the bubbles and other features that are apparently there in the code
September 27, 2025
August 3, 2025
Amazing indicator! Once you learn how to use it it really helps out so much, love it!
July 9, 2025
Pros: Real-time tick flow visualization with buy/sell separation. Helps assess market activity and hidden liquidity. Easy to set up, works stable on major assets. Cons: No alerts on tick spikes. No history or tooltips. Requires experience to interpret data correctly.
July 3, 2025
June 20, 2025
Great indicator. It takes a bit of work to learn how to use it properly. Not to be used in isolation, you need to plan potential reversal zones.
April 15, 2025
This looks promising! I tested it out manually, but I would love to automate it! How could we get the source code? :) Really, Pls.
ディスカッション
よくあるご質問
VWAP
cTrader Storeで入手可能な取引ボット、インジケーター、プラグインなどの商品は、第三者の開発者が提供するものであり、情報と技術の取得のみを目的としてご利用いただけます。cTrader Storeはブローカーではなく、投資助言や個人的な推奨を行うことも、将来のパフォーマンスを保証することもありません。


価格
登録日 12/12/2024
1
販売
33.36K
無料インストール