Penerangan
Sistem Weis & Wyckoff kini menyokong mana-mana carta! [Lilin, Tick, Renko, Julat, Heikin-Ash]
Deskripsi Terakhir -> 11/11/2025
Sistem Weis & Wyckoff memperlihatkan konsep David H. Weis dan Richard Wyckoff
Apa yang baru dalam Semakan 1?
- Sokongan untuk Carta [Lilin, Heikin-Ash, Tick, Julat]
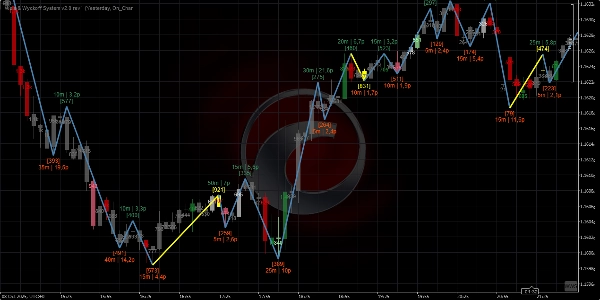
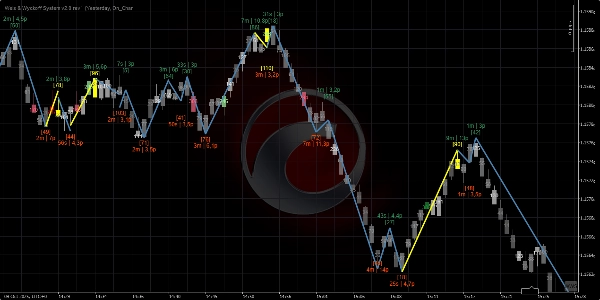
- ZigZag yang Dipertingkatkan => sokongan MTF + Mod [ATR, Peratusan, Pips, NoLag_TinggiRendah]
- Termasuk semua penambahbaikan berkaitan "Order Flow Aggregated"
-
- MA Tersuai
- Lukisan Prestasi
- Penapis Kekuatan (MA/StdDev/Kedua-duanya)
- VP_Tick() Berprestasi Tinggi
- GetWicks() Berprestasi Tinggi
- Pengumpulan Data Tick Asinkron
- Pembaikan => Panel Params pada MacOS
==========================
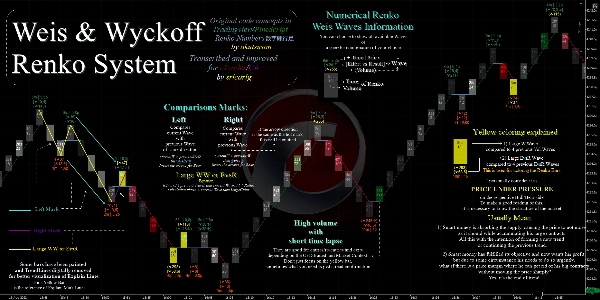
Ia hanyalah satu cara untuk memvisualisasikan Gelombang dan Isipadu secara berangka, ia bukan idea asal.
Anda boleh menemui cara visualisasi ini pertama kali di:
- David Weis mengenai Wyckoff | Sokongan/Perlawanan | dan Gelombang,
- Weis pada Carta Wyckoff Renko - Linda Raschke (terkini)
Ini menggunakan konsep kod dari:
- (Numbers-Renko 数字練行足 dalam PineScript),
- Terima kasih kepada akutsusho!.
Saya memperbaikinya dan membawanya ke cTrader/C# dan ia juga percuma/sumber terbuka.
=========================================
Ditranskripsi & Diperbaiki untuk cTrader/C#
oleh srlcarlg
Kod Konsep Asal dalam TradingView/Pinescript
oleh akutsusho
=========================================
Sentiasa utamakan versi Kedai cTrader, ia dikemas kini terlebih dahulu.
Semua penunjuk yang saya bangunkan adalah sumber terbuka. Jika anda tidak mempunyai akses kepada kod, lihat repositori Github
Ringkasan
Key features include:
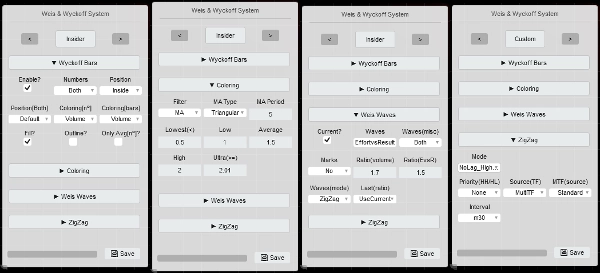
- A versatile Params Panel with four layout templates (Insider, Time, Volume, BigBrain) for quick and user-friendly customization.
- Enhanced ZigZag functionality with multi-timeframe support and multiple modes such as ATR, Percentage, Pips, and NoLag High/Low.
- Integration of order flow aggregation improvements, including custom moving averages, performance drawing, strength filters (MA, StdDev, or both), and high-performance tick volume and wick calculations.
- Dynamic TimeLapse feature showing time waves across various intervals from milliseconds to days.
- Compatibility with Mac OS and requires .NET 6.0 or higher.
The indicator is a C# adaptation and improvement of original PineScript concepts, designed to provide detailed wave and volume visualization without repainting options. It is maintained as open source, with code available on GitHub for transparency and further development.
Ulasan pelanggan
5 | 100 % | |
4 | 0 % | |
3 | 0 % | |
2 | 0 % | |
1 | 0 % |