
E7 Volume Profile
Indikator
1.15K unduhan
Versi 1.0, Feb 2025
Windows, Mac
4.6
Ulasan: 3
Deskripsi
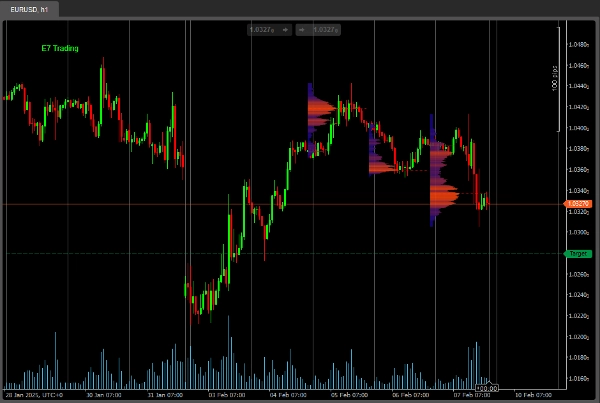
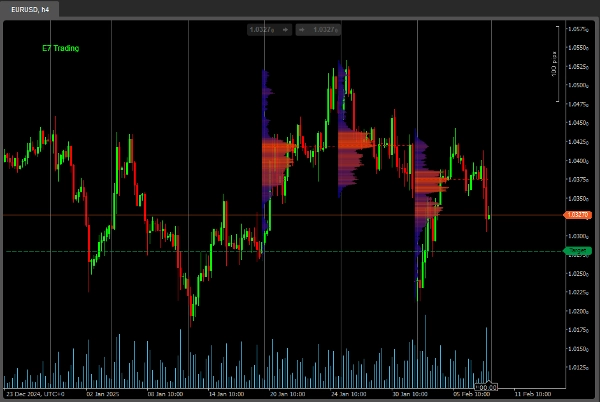
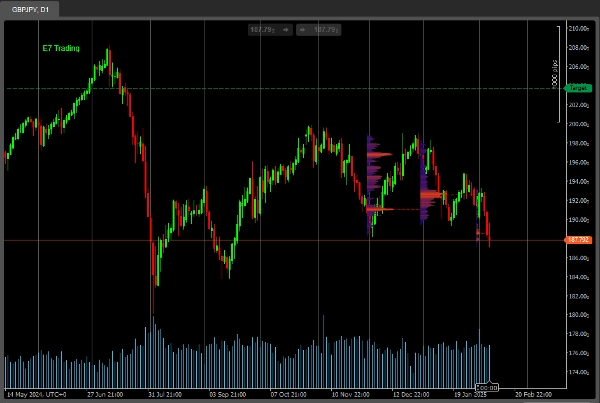
Ini adalah indikator Volume Profile sederhana, disesuaikan untuk tampilan dan nuansa yang lebih modern.
Versi dasar ini terbatas hanya pada 3 'Periode Lookback'.
Versi lengkap akan segera hadir, pantau terus di sini.
Selamat berburu!
Ringkasan
Ringkasan AI
E7 Volume Profile is a volume profile indicator designed with a modern visual style. It provides traders with volume distribution information over price levels, helping to identify key support and resistance areas. This basic version supports analysis over three distinct lookback periods, allowing users to observe volume patterns within limited historical ranges. The indicator is suitable for use on various timeframes, as illustrated by examples on 1-hour, 4-hour, and daily charts. A full version with expanded features is planned for future release.
Profil indikator
Ulasan pelanggan
4.6
Ulasan: 3
5 | 67 % | |
4 | 33 % | |
3 | 0 % | |
2 | 0 % | |
1 | 0 % |
Ulasan pelanggan
July 14, 2025
Pros: Clearly visualizes volume distribution with POC, VAH, VAL zones. Customizable and stable across timeframes. Cons: No tooltips or alerts. Lacks template saving and dynamic profile history. Requires confirmation tools for trading signals.
Diskusi
Pertanyaan umum
Produk-produk yang tersedia melalui cTrader Store, termasuk bot trading, indikator, dan plugin, disediakan oleh pengembang pihak ketiga serta hanya ditujukan untuk akses teknis dan informasi. cTrader Store bukan broker dan tidak menyediakan saran investasi, rekomendasi pribadi, atau jaminan apa pun tentang kinerja di masa mendatang.
Produk lain dari penulis ini


Harga
Sejak 18/12/2024
2
Penjualan
4.24K
Instal gratis