الوصف
PatternScanner – كاشف أنماط المخططات التلقائي لـ cTrader
PatternScanner هو كاشف بصري لأنماط المخططات لـ cTrader يقوم تلقائيًا بالعثور على أهم الهياكل الكلاسيكية للانعكاس ويرسمها مباشرة على مخططك.
بدلاً من البحث يدويًا عن الأنماط شريطًا بشريط، يقوم المؤشر بمسح قمم وقيعان التأرجح في الوقت الحقيقي ويسلط الضوء على:
- الرأس والكتفين (H&S) – هبوطية
- الرأس والكتفين المعكوسة (INV H&S) – صعودية
- القمة المزدوجة (DT) – هبوطية
- القاع المزدوج (DB) – صعودية
- آذان الذئب (WOLF) – نمط "على غرار القمة المزدوجة" مع قمة ثانية أعلى قليلاً
يتم تمييز كل نمط بـ تسمية (H&S, INV H&S, DT, DB, WOLF) و مجموعة من الخطوط التي تحدد الهيكل، بحيث يمكنك رؤية النمط بنظرة سريعة دون تخمين.
الميزات الرئيسية
- ✅ يكتشف تلقائيًا قمم وقيعان التأرجح ويبني الأنماط منها
- ✅ يحدد الرأس والكتفين و الرأس والكتفين المعكوسة مع رسم خط الرقبة
- ✅ يكتشف القمم المزدوجة / القيعان المزدوجة ويربط بين القمتين/القاعين الرئيسيين
- ✅ يتعرف على آذان الذئب دون تداخل مع إشارة القمة المزدوجة القياسية
- ✅ يرسم خطوط متعرجة بين نقاط التأرجح لتحديد كل نمط بصريًا
- ✅ أسطورة مدمجة في الزاوية العلوية اليسرى تشرح جميع رموز الأنماط (H&S, INV H&S, DT, DB, WOLF)
- ✅ تراكب كامل – كل شيء مرسوم على مخطط السعر، لا حاجة لنافذة فرعية إضافية
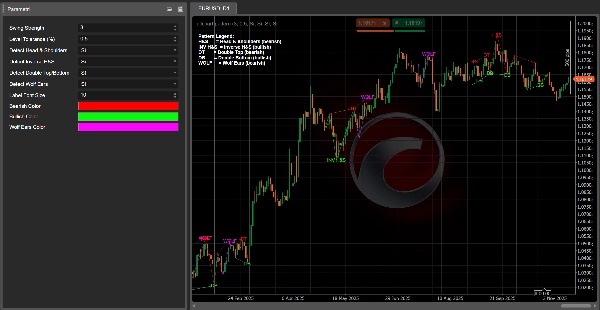
المدخلات / المعلمات
- قوة التأرجح – عدد الأشرطة المستخدمة لتأكيد قمة/قاع التأرجح (حساسية المحور).
- تحمل المستوى (%) – مدى تشابه قمتين/قاعين ليتم اعتباره "على نفس المستوى".
- كشف الرأس والكتفين – تمكين/تعطيل كشف H&S.
- كشف الرأس والكتفين المعكوسة – تمكين/تعطيل كشف H&S المعكوسة.
- كشف القمة/القاع المزدوج – تمكين/تعطيل كشف DT/DB.
- كشف آذان الذئب – تمكين/تعطيل كشف آذان الذئب.
- حجم خط التسمية – حجم تسميات الأنماط على المخطط.
- لون هبوطي – اللون المستخدم للأنماط الهبوطية (H&S, DT, WOLF).
- لون صعودي – اللون المستخدم للأنماط الصعودية (INV H&S, DB).
- لون آذان الذئب – لون مخصص لخطوط ونص نمط WOLF.
كيف يرسم الأنماط
- الرأس والكتفين / الرأس والكتفين المعكوسة
-
- خط متعرج يمر عبر 5 نقاط تأرجح رئيسية (كتف – رأس – كتف).
- خط الرقبة مرسوم كخط اتجاه منقط بين القاعين (لـ H&S) أو القمتين (لـ H&S المعكوسة).
- القمة المزدوجة / القاع المزدوج
-
- تسمية (DT أو DB) عند القمة/القاع الثاني.
- خط اتجاه يربط بين القمتين (DT) أو القاعين (DB).
- آذان الذئب
-
- خط متعرج عبر هيكل القمة–القاع–القمة.
- خط مقاومة منقط عبر القمتين.
- يتم الإشارة إلى آذان الذئب فقط عندما تكون القمة الثانية أعلى بوضوح من الأولى، لذلك لا تتداخل مع القمة المزدوجة العادية.
كيفية الاستخدام
قم بإرفاق PatternScanner إلى أي رمز وزمن زمني ودعه يعمل كـ رادار بصري للهياكل الرئيسية للانعكاس:
- تحديد مناطق الانعكاس المحتملة حول أنماط H&S, DT/DB و WOLF
- الدمج مع عوامل التصفية الخاصة بك (الاتجاه، الحجم، الدعم/المقاومة) لدخول الصفقات
- استخدام الأسطورة في الزاوية العلوية اليسرى لقراءة النمط المعروض بسرعة
إنه ليس نظام تداول مستقل، بل هو أداة تعرف على الأنماط قوية توفر عليك الوقت وتساعدك على التركيز على أكثر الهياكل إثارة للاهتمام على المخطط.
👉 انضم إلى مجتمعنا
داخل الخادم ستجد:
- دعم لهذا المؤشر وغيره من مؤشرات/روبوتات cTrader الخاصة بي
- مناقشة الاستراتيجيات، أمثلة الأنماط وأفكار التحسين
- التحديثات، الأخبار والأدوات المستقبلية التي أطلقها
الملخص
تقييمات العملاء
5 | 0 % | |
4 | 100 % | |
3 | 0 % | |
2 | 0 % | |
1 | 0 % |