Descripción
BB20 Multicolor
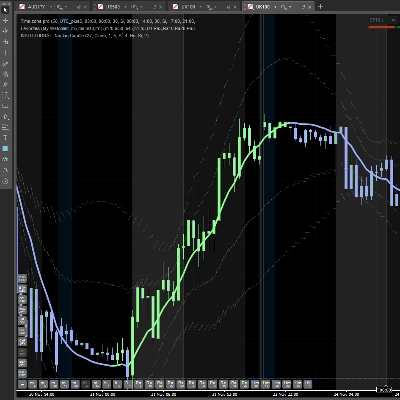
Un potente indicador de identificación de ciclos de mercado que se superpone directamente en tu gráfico, codificando con colores la acción del precio a través de 8 estados de mercado distintos — desde un fuerte bajista hasta completamente alcista — utilizando la relación entre el precio y cuatro medias móviles clave (MM20, MM50, MM100, MM200) combinadas con las Bandas de Bollinger.
──────────────────────────
CÓMO FUNCIONA
──────────────────────────
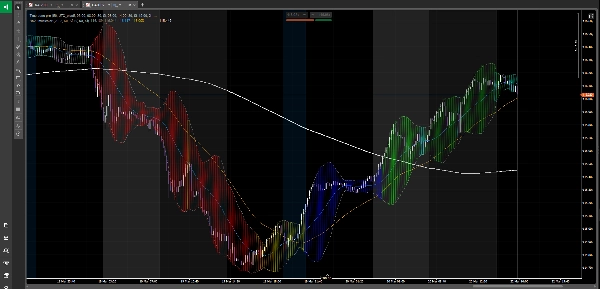
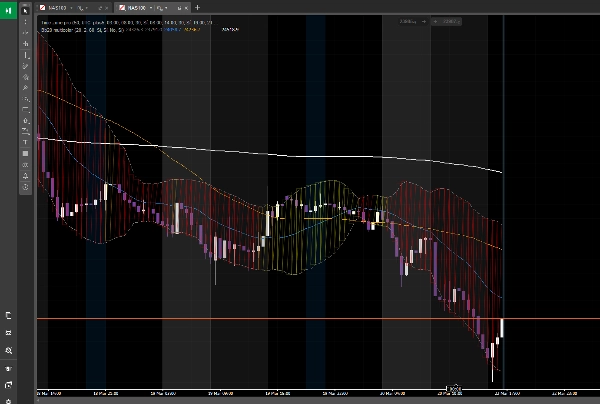
El indicador evalúa constantemente la posición del precio en relación con las cuatro medias móviles y asigna uno de 8 colores a la zona de la nube de las Bandas de Bollinger, dándote una lectura visual instantánea de la etapa actual del ciclo de mercado:
🔴 ROJO — Tendencia bajista clara
El precio está por debajo de la MM200. El mercado está dominado por vendedores. Sesgo: solo cortos.
🟠 NARANJA — Rebote técnico
El precio está por debajo de la MM200 pero se ha recuperado por encima de la MM20. Un rebote dentro de una tendencia bajista — no una reversión. Zona común de trampa alcista.
🟡 AMARILLO — Fase del ciclo 1
El precio ha cruzado por encima de la MM50 pero las medias móviles aún son bajistas. Primeros signos de recuperación, aún no confirmados.
🔵 AZUL — Intento de reversión de tendencia
La MM100 y la MM50 están por debajo de la MM200, pero el precio está comenzando a subir entre ellas. Zona de transición de alta volatilidad — observa con atención.
⬜ GRIS — Neutral / debilitamiento
El precio está por encima de la MM200 pero por debajo de la MM100. La estructura a largo plazo sigue siendo alcista pero el impulso está disminuyendo. Zona de precaución.
🟢 VERDE LIMA — Fase del ciclo 2
El precio y la MM50 están por encima de la MM200. Se está confirmando un nuevo ciclo alcista. Muchos traders institucionales comienzan a posicionarse aquí.
🪵 VERDE AZULADO — Consolidación saludable
El precio está por encima de la MM200 y la MM100 pero retrocede hacia la MM50 o la MM20. Una pausa normal dentro de una tendencia alcista — zona potencial de reentrada.
🌲 VERDE OSCURO — Ciclo alcista maduro
Todas las medias móviles completamente alineadas: MM200 < MM50 < MM20 < Precio. Entorno de tendencia más limpio. Resistencia mínima al alza.
──────────────────────────
CARACTERÍSTICAS
──────────────────────────
• Zonas de nube renderizadas nativamente con Chart.DrawTriangle de cTrader para rellenos suaves y de aspecto profesional
• Bandas de Bollinger (superior e inferior) mostradas junto a la nube
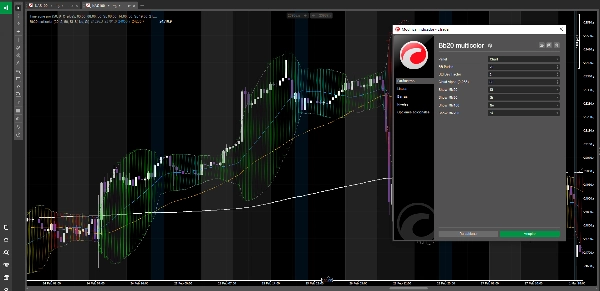
• Las cuatro medias móviles son activables individualmente (MM20, MM50, MM100, MM200)
• Período de BB configurable, factor de desviación estándar y transparencia de la nube
• Funciona en cualquier instrumento y en cualquier marco temporal
• Código abierto completo — gratis para siempre
──────────────────────────
CÓMO USARLO
──────────────────────────
1. Usa el color como filtro de contexto de mercado antes de realizar cualquier operación
2. Solo busca largos cuando el fondo sea verde (lima o oscuro)
3. Solo busca cortos cuando el fondo sea rojo o naranja
4. Usa amarillo, azul y gris como zonas de transición — reduce el tamaño o espera confirmación
5. El verde azulado es tu zona de reentrada en una tendencia alcista establecida
Compatible con cualquier estrategia de trading. Particularmente efectivo cuando se combina con acción del precio, análisis de volumen o enfoques basados en el sentimiento.
Instálalo, colócalo en tu gráfico y conoce al instante en qué fase se encuentra el mercado.
⚠️ AVISO DE RIESGO
Operar con instrumentos financieros implica riesgos y no es adecuado para todos. Siempre realiza tu propio análisis, gestiona tu riesgo cuidadosamente y nunca operes con dinero que no puedas permitirte perder.
Este indicador es una herramienta de análisis técnico — no un consejo financiero. Úsalo con sabiduría.
Resumen
- Red: Clear bearish trend (price below MM200)
- Orange: Technical bounce within bearish trend
- Yellow: Early recovery signs (price above MM50, but MAs bearish)
- Blue: Trend reversal attempt with high volatility
- Gray: Neutral or weakening momentum (price above MM200 but below MM100)
- Lime Green: Confirmed new bullish cycle (price and MM50 above MM200)
- Teal: Healthy consolidation in bullish trend (price above MM200 and MM100, pulling back)
- Dark Green: Mature bullish cycle with aligned moving averages
Features include native cloud rendering using cTrader's Chart.DrawTriangle, toggleable moving averages, configurable Bollinger Bands parameters, and compatibility with any instrument and timeframe. The indicator is open source and free to use. It serves as a market context filter to guide trade decisions, recommending long positions in green zones and shorts in red/orange zones, with caution advised in transition colors. It complements various trading strategies, including price action and volume analysis.