
Opis
EMAScalpHistogram: Wizualizacja momentum do zarządzania handlem
Czym jest EMAScalpHistogram?
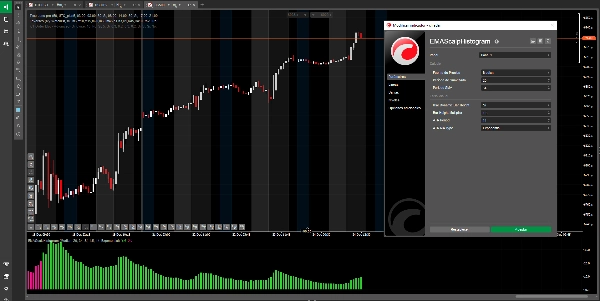
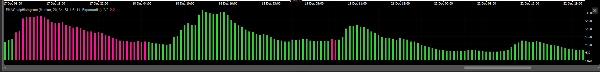
EMAScalpHistogram to zaawansowane narzędzie analizy technicznej, które przekształca złożoność momentum rynku w intuicyjny i atrakcyjny wizualnie histogram. Jego konstrukcja pozwala na szybkie rozpoznanie siły i kierunku trendu.
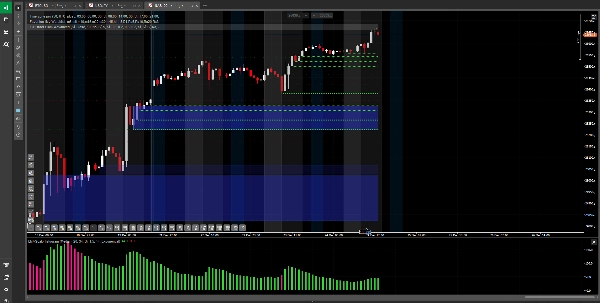
- Zielone słupki (bycze): Wskazują na silne momentum kupna, sugerując, że kupujący kontrolują rynek.
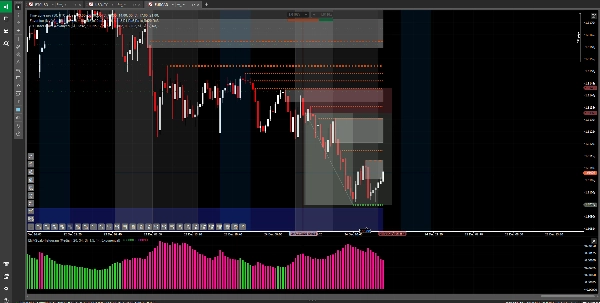
- Różowe słupki (niedźwiedzie): Wskazują na silne momentum sprzedaży, sugerując, że sprzedający dominują w ruchu cen.
- Dynamiczna wysokość: Wysokość słupków nie jest stała; dostosowuje się do zmienności rynku. Wyższe słupki sygnalizują ruchy z większą siłą i przekonaniem, podczas gdy niższe wskazują na pauzę lub osłabienie trendu.
Główne zastosowanie i zalecana strategia
EMAScalpHistogram to elitarne narzędzie do zarządzania handlem, stworzone dla traderów, którzy chcą maksymalizować zyski, utrzymując pozycje z większą pewnością. Jego największą wartością jest pomoc w utrzymaniu i zwiększaniu zysków, gdy już znajdujesz się w transakcji.
- Potwierdzenie trendu: Jego najsilniejszą funkcją jest weryfikacja siły trendu, który już zidentyfikowałeś. Jeśli jesteś na pozycji długiej, a histogram konsekwentnie pokazuje zielone słupki, jest to wizualne potwierdzenie, że momentum kupna pozostaje nienaruszone.
- Zarządzanie handlem (utrzymanie i zwiększanie zysków):
-
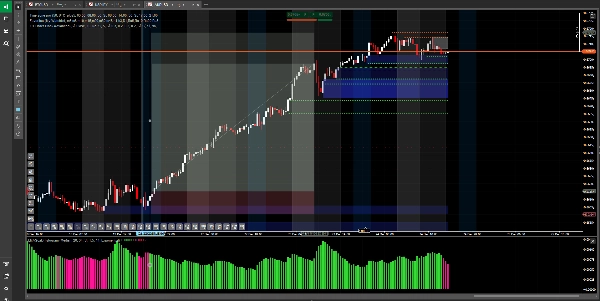
- Utrzymanie pozycji: To jego najcenniejsze zastosowanie. Użyj go, aby zdecydować kiedy z pewnością utrzymać pozycję. Jeśli histogram nadal pokazuje słupki na twoją korzyść, daje ci dyscyplinę, by nie zamykać zyskownej transakcji przedwcześnie z powodu drobnych wahań rynku.
- Zwiększanie zysków: Pomagając utrzymać pozycję przez cały silny etap momentum, pozwala uchwycić większe ruchy i zwiększyć potencjał zysku.
- Alert o osłabieniu momentum: Zmiana koloru histogramu (z zielonego na różowy lub odwrotnie) jest jednym z pierwszych sygnałów, że momentum się wyczerpuje, sugerując, że może to być dobry moment na zabezpieczenie zysków lub dostosowanie strategii wyjścia.
Czego unikać
Nie jest sygnałem wejścia: Krytycznie, EMAScalpHistogram nie jest zaprojektowany do używania jako samodzielny sygnał do otwierania nowych transakcji. Jako wskaźnik potwierdzający siłę ruchu już trwającego, używanie go do wejścia może skutkować spóźnionymi transakcjami o wysokim ryzyku i ograniczonym potencjale zysku.
Ostrzeżenie o ryzyku i zastrzeżenie
Korzystanie z tego wskaźnika odbywa się na własne ryzyko i odpowiedzialność. Handel instrumentami finansowymi wiąże się z wysokim poziomem ryzyka i może nie być odpowiedni dla wszystkich inwestorów. To narzędzie nie stanowi rekomendacji inwestycyjnej ani porady finansowej. Wyniki historyczne nie gwarantują rezultatów w przyszłości. Zaleca się zdecydowanie testowanie każdej strategii na koncie demo przed ryzykowaniem prawdziwego kapitału.
Podsumowanie
Opinie klientów
5 | 67 % | |
4 | 33 % | |
3 | 0 % | |
2 | 0 % | |
1 | 0 % |


