Mô tả
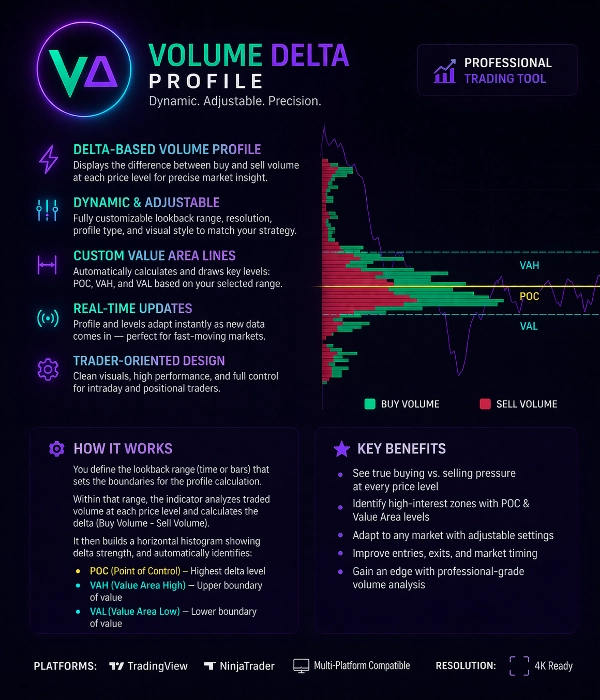
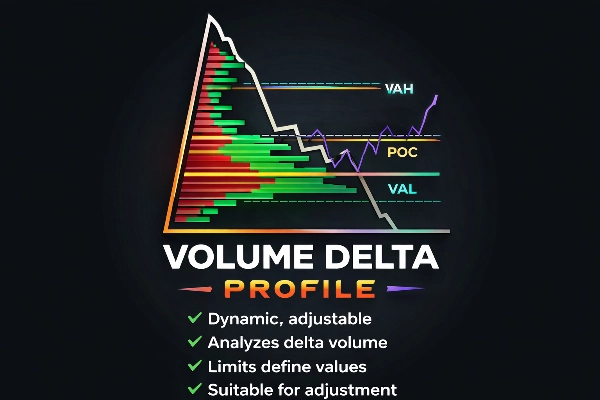
Hồ sơ Delta Khối lượng
Thông tin Chuyên nghiệp về Dòng Lệnh cho Nhà Giao dịch Nâng cao
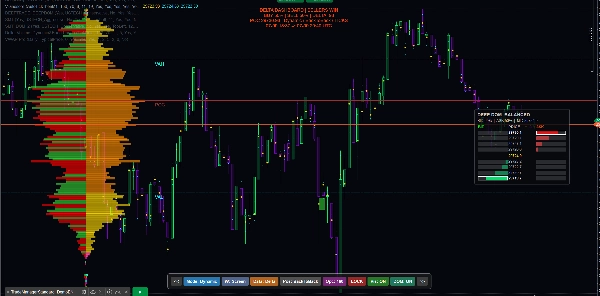
Hồ sơ Delta Khối lượng là một công cụ giao dịch mạnh mẽ được thiết kế để tiết lộ cân bằng thực sự giữa người mua và người bán ở mỗi mức giá.
Khác với các hồ sơ khối lượng truyền thống, chỉ báo này phân tích Delta Khối lượng (Khối lượng Mua – Khối lượng Bán) để hiển thị nơi các nhà tham gia thị trường tích cực đang chiếm ưu thế.
Nó giúp các nhà giao dịch xác định hoạt động tổ chức, vùng hấp thụ và các mức giá có sự quan tâm cao một cách chính xác.
Các Tính năng Chính
Hồ sơ Khối lượng Dựa trên Delta
Chỉ báo tính toán delta khối lượng ở mỗi mức giá, phân tách:
• Áp lực mua tích cực
• Áp lực bán tích cực
Điều này tiết lộ ai thực sự kiểm soát thị trường.
Phạm vi Hồ sơ Linh hoạt & Có thể Điều chỉnh
Phạm vi tính toán hồ sơ là hoàn toàn tùy chỉnh.
Người dùng có thể xác định khu vực tính toán bằng cách:
• Phạm vi thanh tùy chỉnh
• Phạm vi phiên
• Lựa chọn thủ công
• Phạm vi động cuộn
Hồ sơ tự động cập nhật khi dữ liệu mới đến.
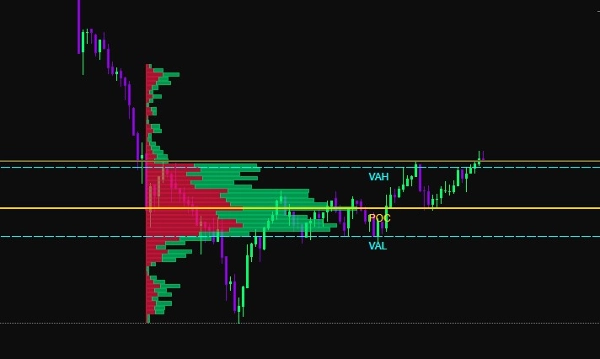
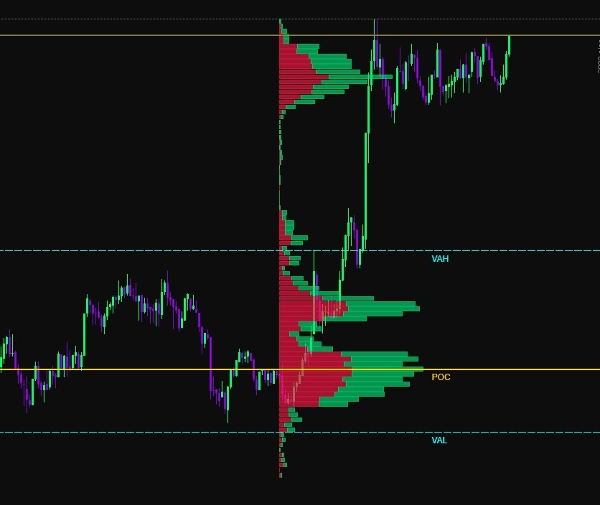
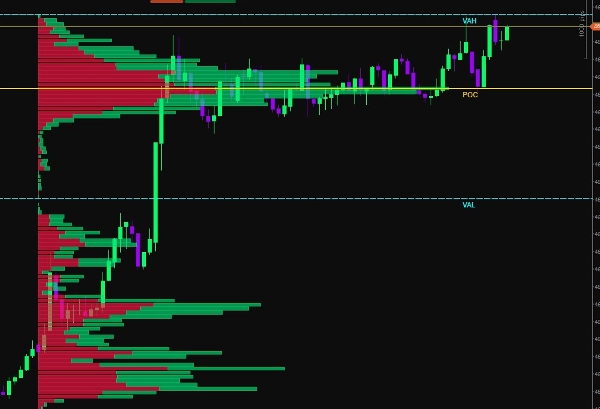
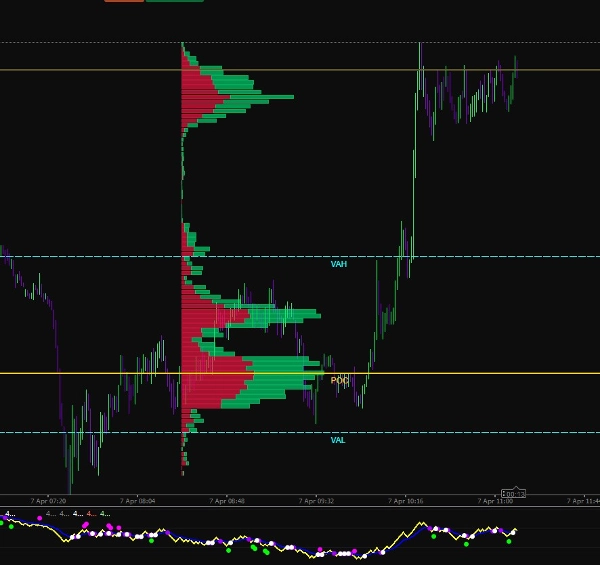
Phát hiện Khu vực Giá trị
Chỉ báo tự động tính toán các mức cấu trúc thị trường chính:
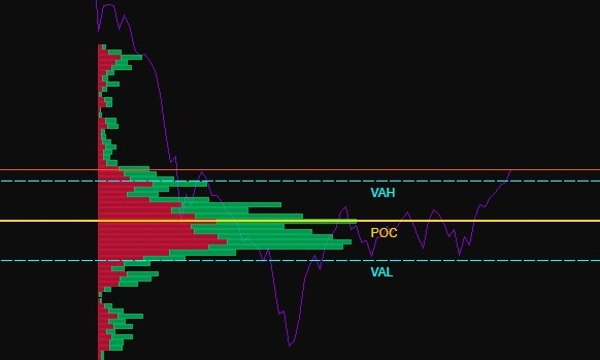
POC (Điểm Kiểm soát)
Mức giá có delta khối lượng giao dịch cao nhất.
VAH (Giá Trị Khu vực Cao)
Ranh giới trên của khu vực giá trị.
VAL (Giá Trị Khu vực Thấp)
Ranh giới dưới của khu vực giá trị.
Những mức này làm nổi bật nơi phần lớn hoạt động thị trường đã diễn ra.
Hiển thị Mua vs Bán
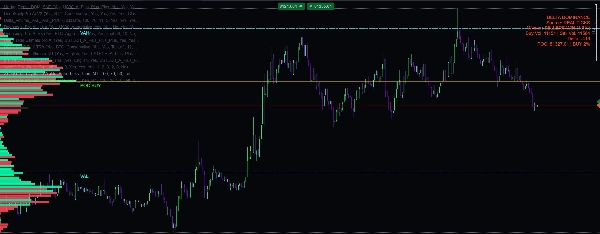
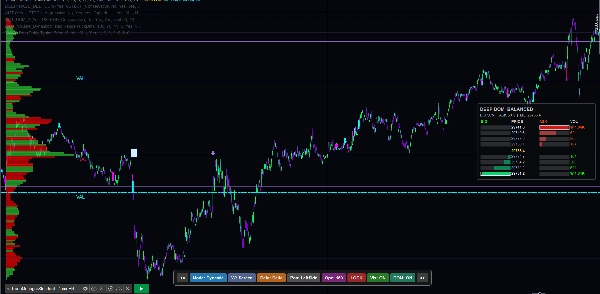
Khối lượng được hiển thị dưới dạng biểu đồ thanh ngang:
Thanh màu xanh lá → Khối lượng Mua chiếm ưu thế
Thanh màu đỏ → Khối lượng Bán chiếm ưu thế
Điều này cho phép các nhà giao dịch ngay lập tức nhìn thấy:
• Vùng hấp thụ
• Vùng mất cân bằng
• Cụm thanh khoản
• Dấu vết tổ chức
Hiển thị Thích ứng
Chỉ báo bao gồm nhiều tùy chọn tùy chỉnh hình ảnh:
• Chiều rộng biểu đồ thanh có thể điều chỉnh
• Bảng màu tùy chỉnh
• Độ trong suốt có thể điều chỉnh
• Kiểm soát độ phân giải
• Kết xuất thích ứng theo thu phóng
Điều này đảm bảo hình ảnh rõ ràng trên tất cả các khung thời gian biểu đồ.
Mức Ranh giới Thông minh
Chỉ báo vẽ các mức tham chiếu động:
• Đường POC
• Đường VAH
• Đường VAL
Những mức này tự động cập nhật dựa trên phạm vi hồ sơ đã chọn và có thể được sử dụng như:
• Hỗ trợ / Kháng cự
• Vùng hồi quy trung bình
• Mức xác nhận phá vỡ
Tính Toán Thời gian Thực
Hồ sơ Delta Khối lượng liên tục tính toán lại sử dụng dữ liệu thị trường trực tiếp.
Điều này đảm bảo các nhà giao dịch luôn nhìn thấy thông tin dòng lệnh cập nhật mới nhất trong các thị trường nhanh.
Các Trường hợp Sử dụng
Công cụ này lý tưởng cho:
• Giao dịch lướt sóng
• Giao dịch trong ngày
• Giao dịch hợp đồng tương lai
• Phân tích dòng lệnh
• Theo dõi thanh khoản
• Phát hiện dấu vết tổ chức
Lợi thế Giao dịch Chính
✔ Xác định áp lực mua thực sự so với bán
✔ Phát hiện vùng hấp thụ và kiệt sức
✔ Xác định các mức thanh khoản cao
✔ Cải thiện độ chính xác khi vào lệnh
✔ Xác nhận các đột phá hoặc đảo chiều
✔ Hiểu cấu trúc thị trường
Thông số Kỹ thuật
Phương pháp Tính toán:
Delta Khối lượng = Khối lượng Mua − Khối lượng Bán
Loại Hồ sơ:
Biểu đồ Thanh Mức Giá Ngang
Các Mức Tự động:
POC, VAH, VAL
Chế độ Cập nhật:
Cập nhật Động Thời gian Thực
Cài đặt Tùy chỉnh:
• Phạm vi Hồ sơ
• Độ phân giải Biểu đồ Thanh
• Tỷ lệ Khối lượng
• Cài đặt Màu sắc
• Hiển thị Mức
Tương thích Nền tảng:
Tối ưu hóa cho kết xuất biểu đồ hiệu suất cao
Thiết kế cho Nhà Giao dịch Chuyên nghiệp
Hồ sơ Delta Khối lượng được xây dựng cho các nhà giao dịch muốn vượt ra ngoài các chỉ báo cơ bản và hiểu cơ chế thực sự của thị trường.
Bằng cách kết hợp phân tích khối lượng, tính toán delta và cấu trúc khu vực giá trị, công cụ này cung cấp một cái nhìn rõ ràng về sự tham gia thị trường và phân phối thanh khoản.
Tóm tắt
Users can customize the profile calculation range using options such as custom bar range, session range, manual selection, or rolling dynamic range, with real-time updates as new market data arrives. Key market structure levels—Point of Control (POC), Value Area High (VAH), and Value Area Low (VAL)—are automatically calculated and drawn as dynamic reference lines, useful for support/resistance, mean reversion, and breakout confirmation.
Additional features include adjustable histogram width, color schemes, transparency, resolution control, and zoom-adaptive rendering for clear visualization across all chart timeframes. The tool supports use cases like scalping, intraday trading, futures trading, order flow analysis, liquidity tracking, and institutional footprint detection. It is optimized for high-performance chart rendering and aims to provide traders with precise insights into market participation and liquidity distribution.