
Tracking Performance by Quantara
Indikator
31 muat turun
Versi 1.0, Feb 2026
Windows, Mac
Penerangan
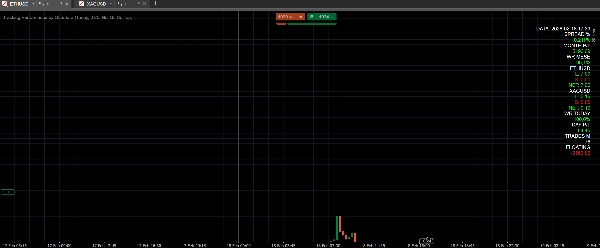
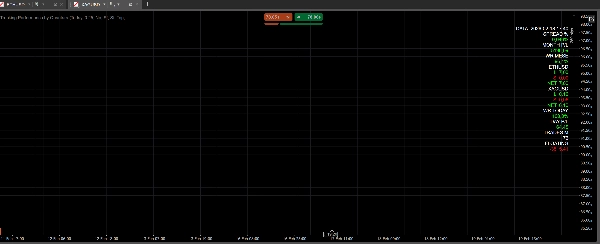
Tracking Perfromance oleh Quantara adalah penunjuk papan pemuka yang memaparkan metrik prestasi masa nyata dan pendedahan setiap aset.
Ia menunjukkan: P/L bulanan dan harian, kadar kemenangan bulanan dan harian, kiraan dagangan bulanan, P/L terapung, spread dalam peratusan, dan panjang/pendek/bersih untuk setiap aset terbuka.
Semua nilai dikodkan warna untuk bacaan cepat (P/L positif/negatif, ambang kadar kemenangan, hijau panjang, merah pendek).
Apa yang dikira/dipaparkan
- Spread % (dengan ambang berbeza untuk logam dan kripto)
- P/L bulanan dan harian
- Kadar kemenangan bulanan dan harian
- Kiraan dagangan bulanan
- P/L terapung
- Pendedahan setiap aset (panjang / pendek / bersih)
Instrumen/kerangka masa yang disyorkan
- Berfungsi pada mana-mana instrumen dan mana-mana kerangka masa
- Dicadangkan pada carta utama (M15–H4) untuk pemantauan harian
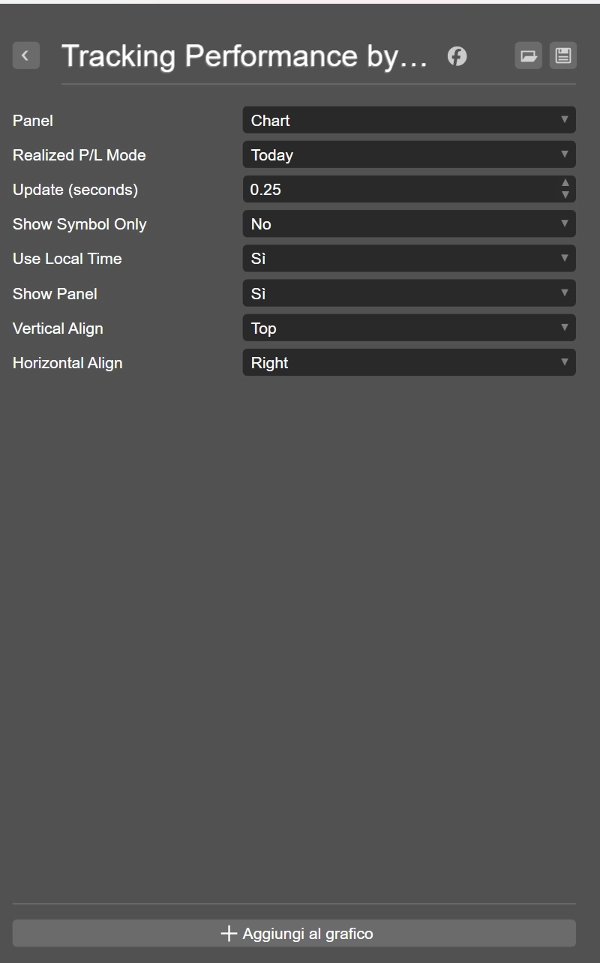
Cara menggunakan
- Tambah penunjuk ke carta
- Tetapkan selang kemas kini (Kemas kini saat)
- Gunakan Tunjukkan Panel untuk togol keterlihatan
- Gunakan “Tunjukkan Simbol Sahaja” untuk menapis kepada simbol carta
- Gunakan “Gunakan Masa Tempatan” untuk menggunakan penapis masa tempatan
Parameter utama
- Kemas kini (saat): kekerapan penyegaran
- Tunjukkan Simbol Sahaja: paparkan hanya simbol carta
- Gunakan Masa Tempatan: gunakan masa tempatan untuk penapis
- Tunjukkan Panel: tunjuk/sembunyi panel
- Penjajaran Menegak/Mendatar: penempatan panel
Kes penggunaan
- Semakan pantas pendedahan bersih setiap aset
- Penjejakan prestasi harian dan bulanan
- Pemantauan kadar kemenangan untuk kualiti operasi
- Pemantauan Spread % untuk logam dan kripto
Penafian
Perdagangan melibatkan risiko. Prestasi lalu tidak menjamin keputusan masa depan.
Ringkasan
Ringkasan AI
Tracking Performance by Quantara is a dashboard indicator designed for real-time monitoring of trading performance across multiple assets. It provides key metrics including monthly and daily profit and loss (P/L), win rate, trade count, floating P/L, and spread percentage, with specific thresholds for metals and cryptocurrencies. The indicator also displays per-asset exposure categorized as long, short, or net positions. All values are dynamically color-coded to facilitate quick interpretation, highlighting positive/negative P/L, win-rate levels, and position types.
This tool is compatible with any trading instrument and timeframe, with a recommendation for use on main charts ranging from 15-minute to 4-hour intervals for daily performance tracking. Users can customize update frequency, toggle panel visibility, filter data to the current chart symbol, and apply local time settings. The indicator supports quick assessment of net exposure, daily and monthly performance, win-rate monitoring, and spread percentage analysis for metals and crypto markets.
Key parameters include update interval, symbol filtering, local time usage, panel display options, and panel alignment. This indicator is applicable across Forex, Indices, Commodities, Crypto, and Stocks markets.
Profil indikator
Ulasan pelanggan
0.0
Ulasan: 0
Ulasan pelanggan
Belum ada ulasan untuk produk ini. Anda sudah mencuba produk tersebut? Jadilah yang pertama untuk berkongsi pendapat anda!
Perbincangan
Soalan Lazim
Forex
Indices
Commodities
Crypto
Stocks
Produk yang tersedia melalui cTrader Store, termasuk bot dagangan, indikator dan plugin, disediakan oleh pembangun pihak ketiga dan diberikan akses untuk tujuan maklumat dan teknikal sahaja. cTrader Store bukan broker dan tidak memberikan nasihat pelaburan, syor peribadi atau sebarang jaminan prestasi masa hadapan.


Harga
Sejak 29/01/2026
31
Pemasangan percuma