
Ichimoku Kinko Hyo
Indicador
155 descargas
Versión 1.0, Jul 2025
Windows, Mac
5.0
Valoraciones: 1
Descripción
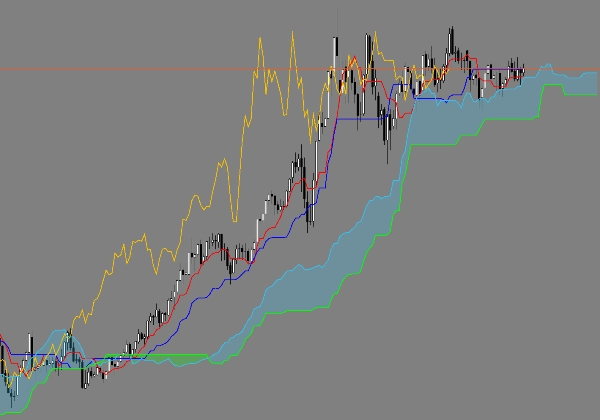
Este es un indicador corregido de Ichimoku Kinkō Hyō para cTrader. Por defecto, el desplazamiento de cTrader es 26 y comienza a contar desde cero, lo que provoca que el Chikou Span y el Kumo (nube) se desplacen incorrectamente. Esta versión corrige eso usando un desplazamiento fijo de 25 períodos tanto para el Chikou Span (movido 25 períodos hacia atrás) como para las líneas del Kumo (movidas 25 períodos hacia adelante), coincidiendo con la especificación japonesa original y plataformas como TradingView. Esto asegura que todas las líneas de Ichimoku se calculen y tracen en las posiciones correctas para señales y análisis precisos.
Resumen
Resumen de IA
This product is a corrected Ichimoku Kinkō Hyō indicator designed for the cTrader platform. It addresses an issue in cTrader’s default Ichimoku implementation, where the displacement is set to 26 and counted from zero, causing misalignment of the Chikou Span and Kumo (cloud) lines. This version applies a fixed 25-period shift: the Chikou Span is moved 25 periods backward, and the Kumo lines are shifted 25 periods forward. This adjustment aligns the indicator’s calculations and plotting with the original Japanese Ichimoku specification and other platforms like TradingView. The correction ensures that all Ichimoku lines are displayed in their proper positions, supporting accurate technical analysis and signal interpretation.
Perfil del indicador
Valoraciones de clientes
5.0
Valoraciones: 1
5 | 100 % | |
4 | 0 % | |
3 | 0 % | |
2 | 0 % | |
1 | 0 % |
Conversación
Preguntas frecuentes
Los productos disponibles a través de cTrader Store, incluidos bots, indicadores y plugins para operar, son proporcionados por desarrolladores de terceros y están disponibles únicamente con fines informativos y de acceso técnico. cTrader Store no es un bróker, por lo que no proporciona asesoramiento de inversión, recomendaciones personales ni ninguna garantía de rentabilidad futura.


Precio
Desde 20/03/2025
155
Instalaciones gratis